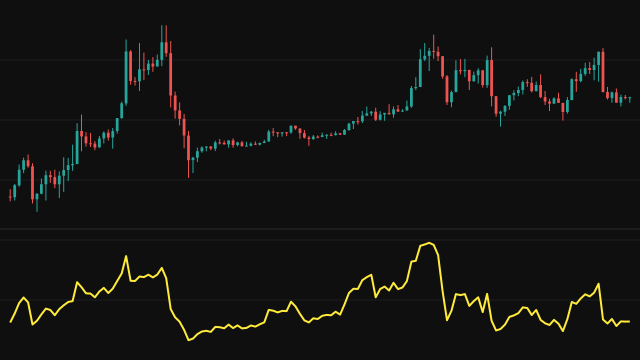
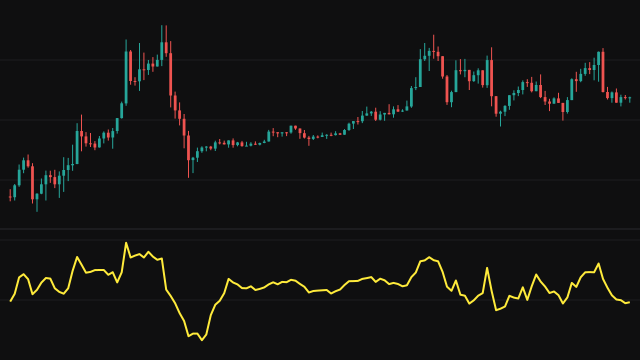
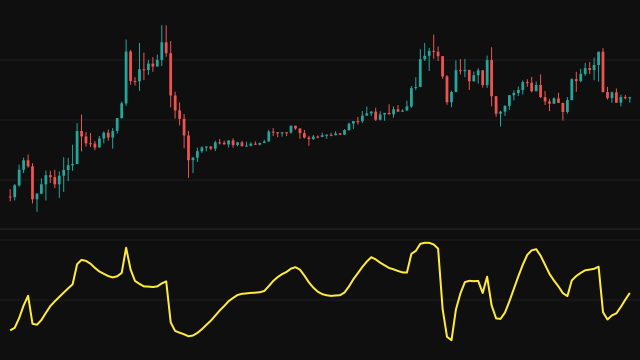
Rate of Change Ratio divides the current source value by the value from an earlier bar. A result of 1 means price is where it was, 1.05 means it is 5 percent higher and 0.95 means it is 5 percent lower.
The lookback starts at zero bars and grows by one on each bar whose reference value is present and not zero, until it reaches length, then stays there. The line therefore starts on the first bar at exactly 1, and the early readings compare against the first bars of the chart rather than leaving a gap.
How to read Rate of Change Ratio (ROCR)
Read the line against 1. Above 1, price is higher than it was over the lookback; below 1, it is lower. The distance from 1 is the size of the move as a fraction of the older price, so the reading compares across instruments.
A ratio is lopsided: a fall of 50 percent reads 0.5 while a rise of 50 percent reads 1.5, so large declines look smaller on the chart than large advances of the same percentage. The first length bars use a shorter lookback.
Settings
- Source
- The price series whose ratio to its earlier value is measured. Close is the default.
- Length
- The full lookback in bars. The lookback grows to it over the first bars and then stays fixed.
Frequently asked questions
Why is the first value exactly 1?
The lookback starts at zero bars, so the first bar is divided by itself. The lookback then grows by a bar on each bar until it reaches length.
How do I turn the ratio into a percentage?
Subtract 1 and multiply by 100. A ratio of 1.03 is a rise of 3 percent. The ROCP study plots that percentage directly.