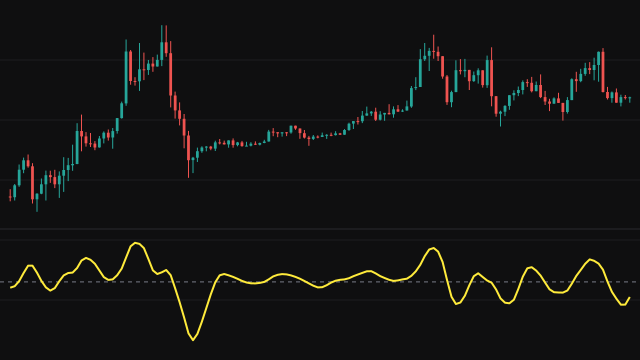
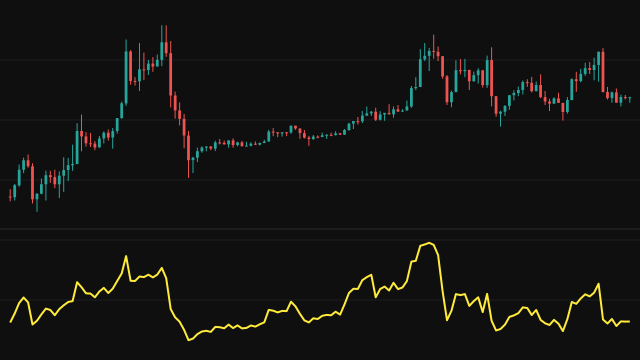
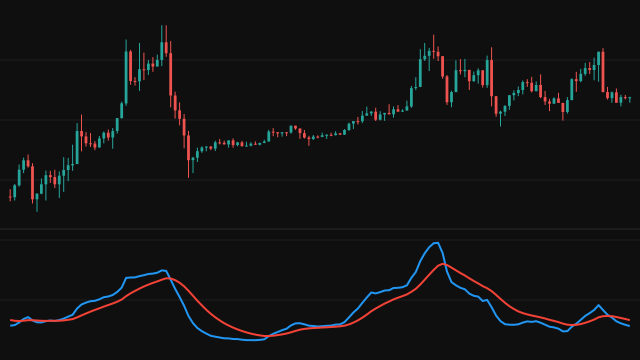
RSX asks the same question as the Relative Strength Index, how large recent rises have been next to recent falls, but smooths the moves with an adaptive filter instead of a plain average. Each bar's change in the source is split into an up move and a down move, and each is fed through its own copy of the filter. The reading is 100 - 100 / (1 + smoothed up / smoothed down), and it is 0 when the smoothed down move is zero.
The filter keeps a pair of trailing bands around its input and measures how far each new value jumps outside them. It compares that jump with its own recent average of jumps, kept over the last ten values, and uses the ratio to set how quickly a two-stage smoother follows the input: a large jump makes it follow faster, a quiet stretch makes it follow slowly. All of its constants are set by length. The first bar has no previous value, so neither side moves and there is no reading until the second bar.
How to read Relative Strength Xtra (RSX)
Read RSX on the same 0 to 100 scale as RSI. High readings mean the smoothed rises have outweighed the smoothed falls, low readings the reverse, and 50 is balance. Because the filter removes most bar-to-bar noise, the line turns less often and more cleanly than RSI at the same length, which makes its turns and its crosses of fixed levels easier to read. Any smoothing adds some delay, so compare its turns with price before relying on them.
The smoother line also means fewer touches of extreme zones, so thresholds that suit RSI may be too wide here. Like any momentum oscillator, it can stay high or low for a long time in a strong trend.
Settings
- Length
- Sets every constant of the adaptive filter. Longer lengths give a smoother line that turns later.
- Source
- The price series whose bar-to-bar changes are measured. Close is the default.
Frequently asked questions
How is RSX different from RSI?
Both compare up moves with down moves on a 0 to 100 scale. RSI smooths them with a running average; RSX uses an adaptive filter that follows quickly after large jumps and slowly in quiet stretches, so its line is much smoother.
Why does it read 0 when there are no down moves?
When the smoothed down move is zero the ratio is taken as zero, so the reading is 0. This is a property of the calculation, not a signal.