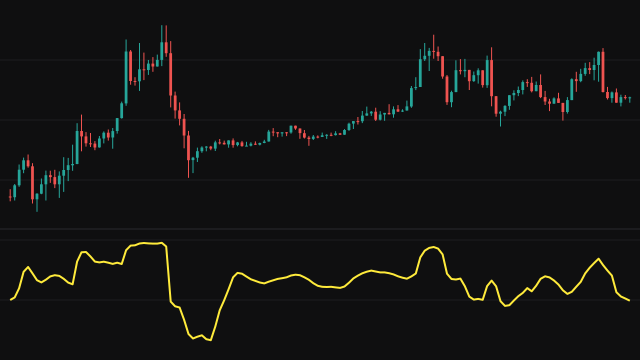
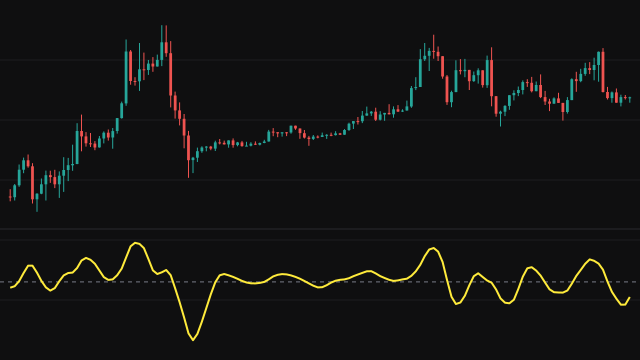
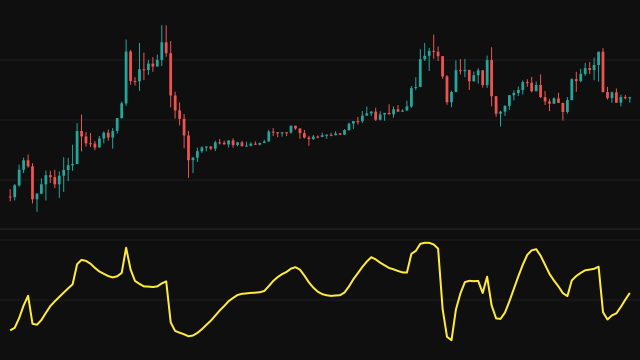
The True Strength Index measures how one-sided recent price changes have been. Each bar's change is the source minus the previous source, with a missing previous value read as zero. The change is smoothed by an exponential average of length longLen and then by one of length shortLen. The absolute size of the change is smoothed the same two ways. The TSI is 100 times the first result divided by the second, and it reads zero when the smoothed size is zero.
Every average here uses a weight of 2 / length. Each starts its accumulator at zero and passes its first value through unchanged; after that the accumulator is divided by (1 - e), where e is (1 - weight) raised to the number of updates, until e drops below 1e-10. The signal line is the same kind of average of the TSI over signalLen bars. Because the first bar's change is the whole price, the first reading is 100.
How to read True Strength Index (TSI)
At lengths of 2 or more the TSI runs from -100 to 100. Near 100 nearly every recent change has been a rise, near -100 nearly every change a fall, and around zero rises and falls have balanced out. Above zero is the shape of upward momentum, below zero downward momentum.
Crosses of the TSI over its signal line are commonly read as momentum turning, and crosses of zero as the balance of changes flipping sides. The double smoothing keeps the line steady, which also means it turns after price does. Ignore the first bars: the first change is the whole price, and the averages need some bars to settle.
Settings
- Source
- The price series whose bar-to-bar changes are measured. Close is the default.
- Long Length
- The length of the first smoothing of the change and of its size. Longer values make the line slower and smoother.
- Short Length
- The length of the second smoothing, applied to the output of the first.
- Signal Length
- The length of the average of the TSI that forms the signal line.
Frequently asked questions
Why does the line start at 100 or -100?
The first bar has no previous value, which is read as zero, so its change is the whole price and fully one-sided. The averages then settle over the following bars.
Why is the reading bounded between -100 and 100?
With every length at 2 or more, each average weighs its inputs with positive weights, so the smoothed change can never be larger in size than the smoothed absolute change and their ratio stays between -1 and 1. A length of 1 gives a weight of 2, which overshoots, and the line can then run far outside that range.
What happens on a bar with no price?
Both lines hold their previous reading, or 50 if there is none yet, and the averages are left untouched.