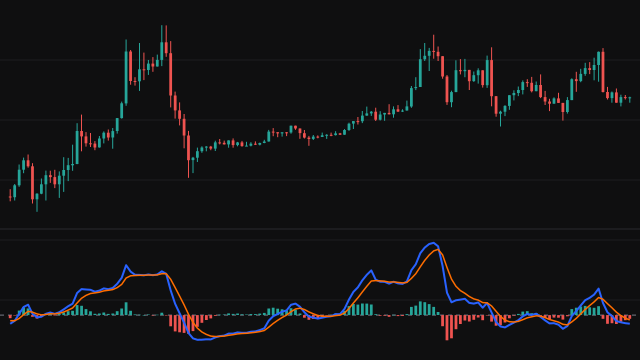
The Volume-Weighted MACD, designed by Buff Dormeier, is a moving average convergence divergence in which the two exponential averages of price are replaced by volume-weighted averages. A volume-weighted average is the sum of each bar's price times its volume over the window, divided by the total volume of the window, so bars with heavy volume count for more than quiet ones.
The line is the fast (12 bar) volume-weighted average minus the slow (26 bar) one. The signal line is a 9 bar exponential average of that line, started from the simple average of its first values, and the histogram is the line minus the signal. The study first answers once the slow average and then the signal have filled.
The histogram is green while the line is at or above its signal and red while it is below.
How to read Volume-Weighted MACD (VW-MACD)
Read it like the familiar moving average convergence divergence. The line above zero means the fast volume-weighted average is above the slow one, an upswing; below zero, a downswing. A crossing of the line over the signal, shown by the histogram changing colour, is the usual entry or exit cue, and a shrinking histogram shows momentum fading before the crossing comes.
Because volume weights the averages, a move made on heavy volume shows up sooner and larger than one made on light volume. The study still lags price, gives many crossings in a sideways market, and its values are in price units, so they do not compare across instruments.
Settings
- Source
- The price series weighted by volume. Close is the default.
- Fast Length
- Bars in the fast volume-weighted average. 12 is the usual value.
- Slow Length
- Bars in the slow volume-weighted average. 26 is the usual value.
- Signal Length
- Bars in the exponential average of the line that forms the signal. 9 is the usual value.
Frequently asked questions
How does volume change the reading?
Each average gives every bar in its window a weight equal to its volume, so the line moves further on heavy-volume bars and barely moves on quiet ones. A trend carried by rising volume shows a wider gap than the same price move on thin volume.
Why is the signal line not volume-weighted?
The volume weighting is applied to the two price averages. The signal is a plain exponential average of the line, as in the standard construction, so the histogram compares like with like.
Can I compare the values across instruments?
No. The line is a difference of prices, so its size depends on the instrument's price level. Compare its direction, crossings and histogram shape instead.