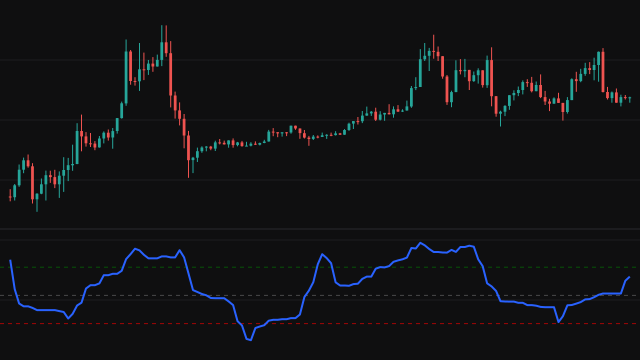
The Disparity Index, described by Steve Nison, shows how far price has stretched from its moving average. On each bar it takes the source, the close by default, subtracts the moving average and divides by the average, then multiplies by 100:
Disparity = 100 * (source - MA) / MA
Nison compared the close with a chosen moving average and left the kind and length open, so both are settings here. The default average is a 14 bar exponential average seeded with the simple average of its first 14 values. The menu also offers a simple, a linearly weighted and a Wilder smoothed average of the same length. Because the result is a percentage, readings compare across instruments and price levels.
The line is green above zero and red below it, with a dashed zero line for reference.
How to read Disparity Index
Above zero the source is above its average, which is bullish pressure; below zero it is below, bearish pressure. The size of the reading shows how stretched the move is. Readings that reach the extremes the instrument has seen before often come near a pause or pullback, since price tends to return toward its average.
A crossing of zero means price has crossed its average, and a divergence, where price makes a new high on a smaller reading, suggests the move is losing strength. In a strong trend the reading can stay stretched for a long time, so an extreme alone is not a reversal signal.
Settings
- Source
- The price series compared with its average. Close is the default.
- Length
- Bars in the moving average. Shorter lengths make the reading swing more around zero.
- Average Type
- The kind of moving average: exponential (the default), simple, linearly weighted or Wilder smoothed.
Frequently asked questions
What reading counts as overbought or oversold?
There is no fixed level. Look at the extremes the instrument has reached on this timeframe and treat readings near them as stretched.
Why is the default an exponential average?
It reacts faster to recent prices than a simple average of the same length, which suits a measure of short-term stretch. The menu lets you switch to the others.
How is it different from a price oscillator?
A price oscillator compares two averages; the Disparity Index compares price itself with one average, so it reacts to every bar's close.