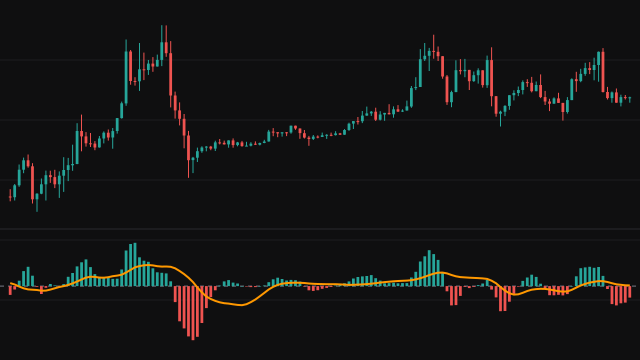
The SMI Ergodic Indicator is a double smoothed momentum oscillator built on William Blau's true strength index. On each bar the change in the source from the previous bar is taken, and both that change and its absolute size are smoothed twice: first by an exponential average over Long Length bars (20 by default), then by one over Short Length bars (5 by default). The SMI line is 100 times the smoothed change divided by the smoothed size, so it runs from -100 to 100.
A Signal line, an exponential average of the SMI over Signal Length bars, follows it, and the Oscillator histogram shows the SMI minus the signal: green at or above zero, red below.
How to read SMI Ergodic Indicator
The SMI above zero means the smoothed changes have been mostly upward, below zero mostly downward, and the distance from zero shows how one-sided they were. A cross of the SMI above its signal line, where the histogram turns from red to green, is read as momentum turning up; a cross below as momentum turning down. Crossings far from zero, after a long run in one direction, carry more weight than those near it.
The double smoothing removes most bar to bar noise but adds lag, and in a sideways market the two lines weave around each other, so the histogram flips often without a lasting move.
Settings
- Source
- The price series whose changes are measured. Close is the default.
- Long Length
- Bars in the first, longer exponential average of the changes. A larger value gives a smoother, slower line. 20 is the usual value.
- Short Length
- Bars in the second, shorter exponential average applied after the first. 5 is the usual value.
- Signal Length
- Bars in the exponential average of the SMI that forms the signal line and sets the histogram. 5 is the usual value.
Frequently asked questions
How is it related to the true strength index?
The SMI line is the true strength index of the source with a long length of 20 and a short length of 5. The study adds a signal line and the histogram of their difference.
What does the histogram show?
The gap between the SMI and its signal line. It turns green when the SMI rises above the signal and red when it falls below, so its colour changes mark the crossings.
Why can it not go beyond 100 or -100?
The smoothed change can never be larger in size than the smoothed size of the changes, so their ratio stays between -1 and 1 before it is scaled by 100.