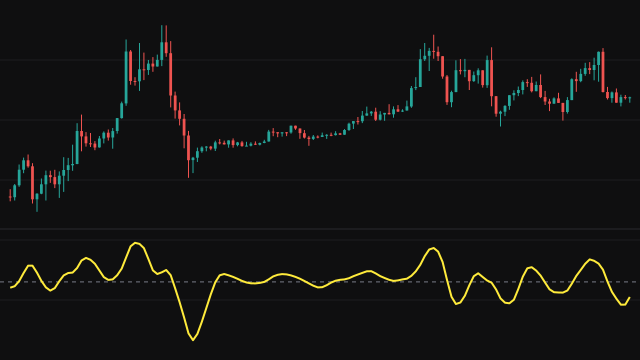
Velocity starts from plain momentum: the source minus the source Length bars ago. That raw difference is noisy, so it is passed through an adaptive smoothing filter of the Jurik family before it is plotted.
The filter tracks two bands around the momentum series and measures how far each new value breaks out of them. That volatility is averaged over ten bars and then over a longer exponential window, and the ratio of the current volatility to its average sets how fast the filter reacts: a sudden move gets a faster response, a quiet stretch a slower one. Two stages follow, a smoothed mean with a phase correction that pushes it ahead of the data and a final error-correcting stage, and their output is the plotted line. The phase is fixed at 100 and the power at 0.2, so the length is the only setting that shapes the filter.
The filter runs from the first bar, fed a zero change while the lookback does not exist yet, and the line starts once Length bars have passed.
How to read Velocity (VEL)
Read it like a momentum oscillator. Above zero the source is higher than it was Length bars ago and the move is up; below zero it is lower. The slope of the line shows whether that momentum is building or fading, and a turn through zero marks the point where the lookback change flips sign.
The smoothing removes much of the jitter of raw momentum without the delay of a long average, but it is still a filter: it can overshoot after a sharp spike, and its values are in price units, so readings on different instruments are not comparable.
Settings
- Length
- How many bars back the change is measured, which also sets how strongly the filter smooths. A longer length gives a slower, smoother line.
- Source
- The price series whose change is measured, the close by default.
Frequently asked questions
How is it different from plain momentum?
Plain momentum is the raw difference between the source and the source a set number of bars ago. Velocity takes that same difference and smooths it with an adaptive filter, so the line is cleaner and turns sooner than a simple moving average of momentum would.
Why does the line start a few bars into the chart?
The change over the lookback needs Length bars of history. The filter is already running before then, but the study draws nothing until the first real lookback difference exists.
Can I change the phase or power of the filter?
No. Both are fixed, at a phase of 100 and a power of 0.2. Only the length changes the filter.