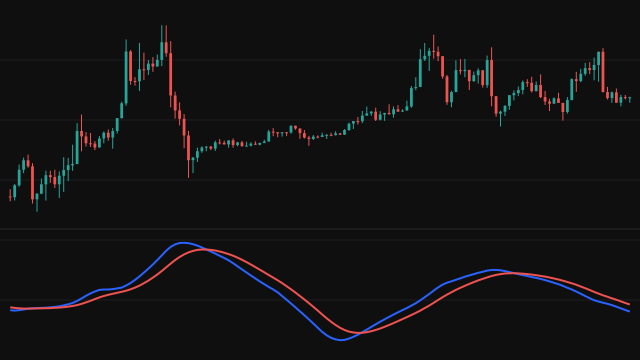
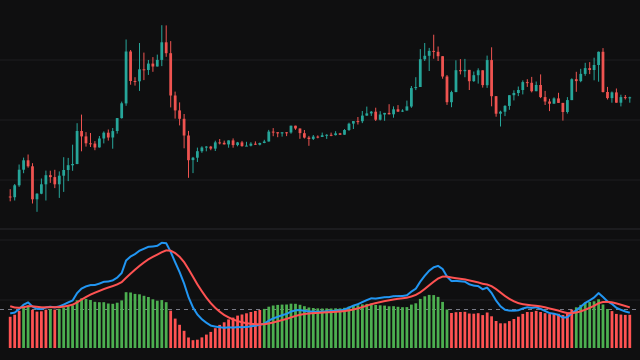
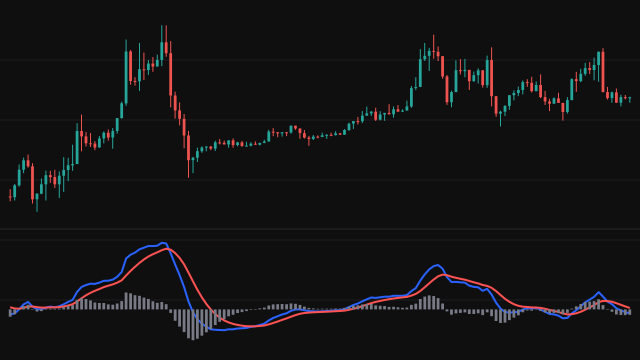
Momentum is the simplest measure of how fast price is moving. On every bar it takes the chosen source and subtracts the value of the same source length bars earlier. The answer is in price units: on a market trading near 60,000 a reading of 500 means price is 500 higher than it was length bars ago.
There is no smoothing and no scaling, so the line reacts as soon as price does and carries all of its noise. The first length bars have no reading, because there is no bar that far back to compare with, and the line starts once there is.
How to read Momentum (MOM)
Above zero, price is higher than it was length bars ago; below zero, it is lower. The further the line is from zero, the faster the move. A line that keeps rising while price rises says the advance is speeding up, and a line that turns down while price is still climbing says the advance is slowing, which often comes before a pause or a turn.
Because the reading is in price units, its size depends on the instrument's price level, so compare it only with its own history on the same chart. A single large bar entering or leaving the window can jump the line, which is the cost of having no smoothing.
Settings
- Length
- How many bars back the comparison reaches. A short length follows every swing; a long one shows the broader trend of the move.
- Source
- The price series compared with its own earlier value. Close is the default; hl2 and the other blends soften bars with long wicks.
Frequently asked questions
Why is the start of the chart blank?
The first reading needs a bar length bars back. Until the chart has that many bars there is nothing to subtract, so the line starts on bar length.
How is this different from Rate of Change Percentage?
Momentum is the raw difference in price units. A percentage rate of change divides that difference by the older price, so its readings compare across instruments and price levels.
Does a zero cross mean anything?
A cross above zero means price has just risen above where it was length bars ago, and a cross below means it has fallen under it. It describes the move; it does not forecast the next one.