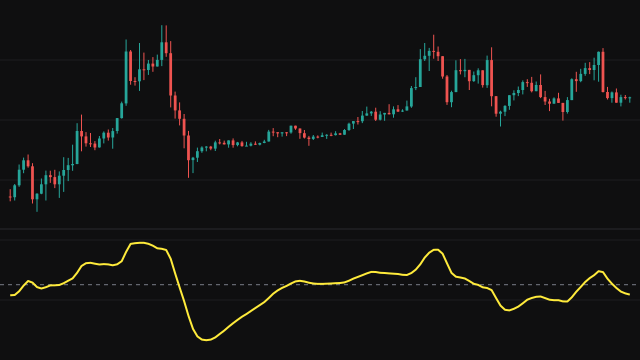
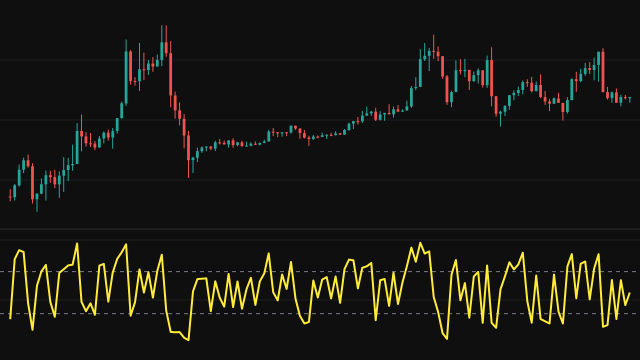
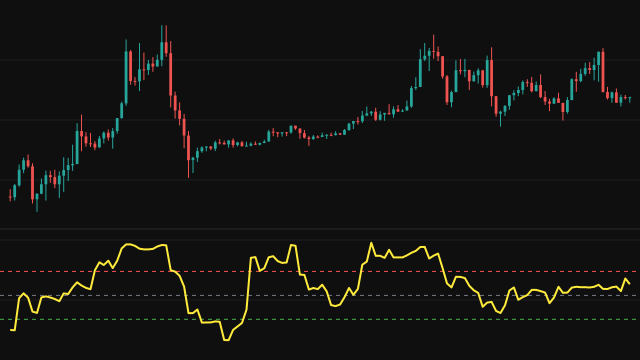
The Correlation Trend Indicator (CTI) measures the correlation between the last N values of the source and a straight line that rises by one each bar. When price has climbed steadily the correlation is close to +1, when it has fallen steadily it is close to -1, and when it has moved without a clear direction it sits near zero.
The sums the correlation needs are kept running over the window. While the window is still filling it uses the bars available, starting from the second bar. A window in which price did not move at all has nothing to correlate and reads zero. The result is held between -1 and +1.
How to read Correlation Trend Indicator (CTI)
Readings above +0.5 describe a fairly orderly uptrend over the window and readings below -0.5 an orderly downtrend. Values between the two dashed lines mean the recent bars have not followed a straight path. A move from near zero toward one side is a sign a trend is forming, and a fall back toward zero is a sign it is losing its shape.
It measures how straight the path was, not how far price travelled, so a slow, steady drift can score higher than a large but jagged move.
Settings
- Source
- The price series the calculation reads, such as the close or the bar midpoint.
- Period
- How many bars the correlation covers. A longer period looks for a longer, steadier trend.
Frequently asked questions
What does a reading of 0.9 mean?
The last N prices lie very close to a straight rising line, so the window has been a steady advance.
Why does it start on the second bar?
A correlation needs at least two points. Until the window is full it uses the bars it has.
Does a high reading mean a big move?
No. It measures how straight the path was, not its size. A small steady rise can score as high as a large one.