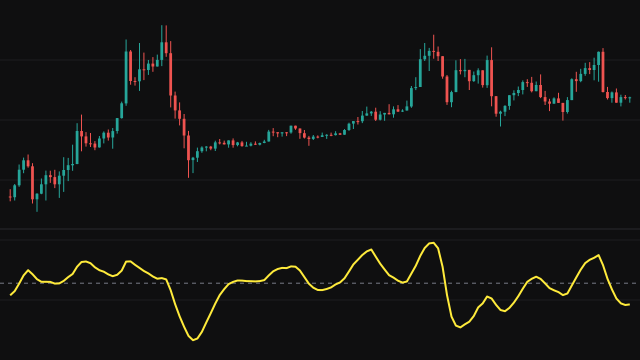
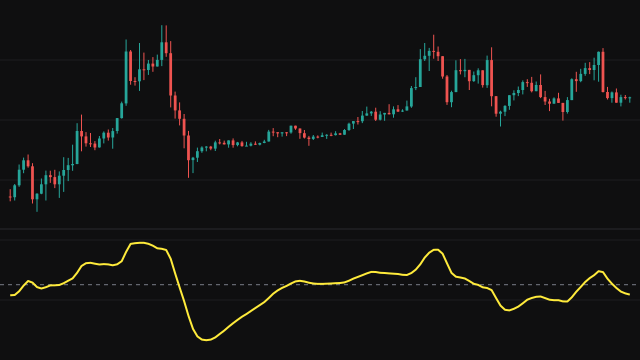
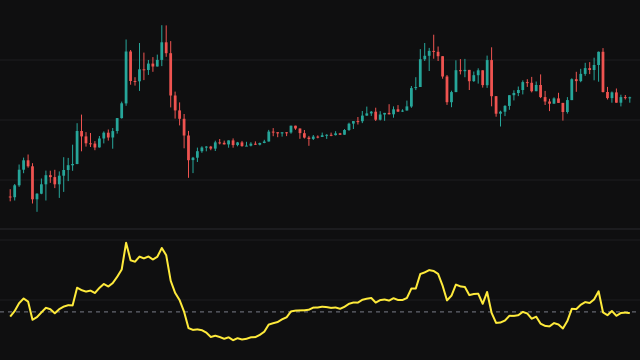
The DeMarker Oscillator (DEM) looks at each bar's extension beyond the previous bar. The up extension is how far the high rose above the previous high, or zero if it did not. The down extension is how far the low fell below the previous low, or zero if it did not. Both are summed over the last N bars, and the oscillator is the up total divided by the sum of both totals.
Bars before the first count as zero in the totals, so the line starts on the first bar with partial totals. When neither side extended at all in the window the reading is 0.5.
How to read DeMarker Oscillator (DEM)
Readings near 1 mean recent bars have mostly been pushing to new highs, and readings near 0 mean they have mostly been pushing to new lows. The dashed lines at 0.7 and 0.3 are the usual overbought and oversold zones, with 0.5 as the balance point. A turn back from beyond 0.7 or 0.3 is often read as momentum fading on that side.
It uses only highs and lows, not closes, so it reflects how far bars reached rather than where they settled. In a strong trend it can stay in an extreme zone for many bars.
Settings
- Period
- How many bars the up and down extensions are summed over. A longer period gives a smoother, slower line.
Frequently asked questions
Why is it 0.5 on some bars?
When no bar in the window extended beyond its predecessor on either side, both totals are zero and the oscillator reads the neutral 0.5.
How is it different from the RSI?
The RSI compares closes; this compares how far highs and lows extended past the previous bar, so it reacts to how far each bar reached.
Why are the first readings different from later ones?
Until N bars exist the totals cover fewer bars, so the early values rest on a shorter window.