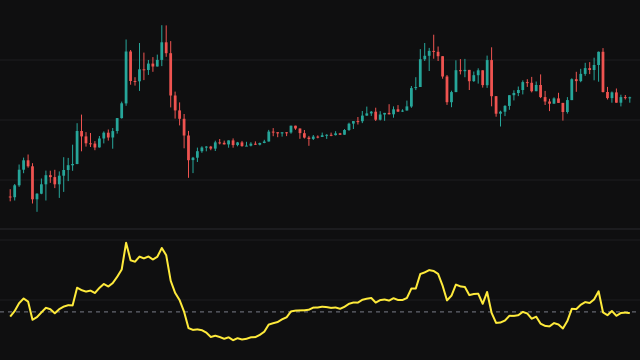
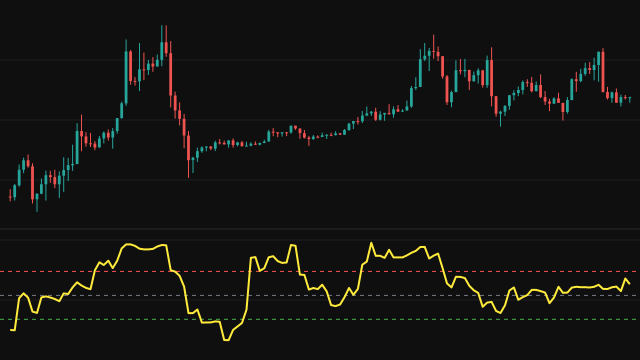
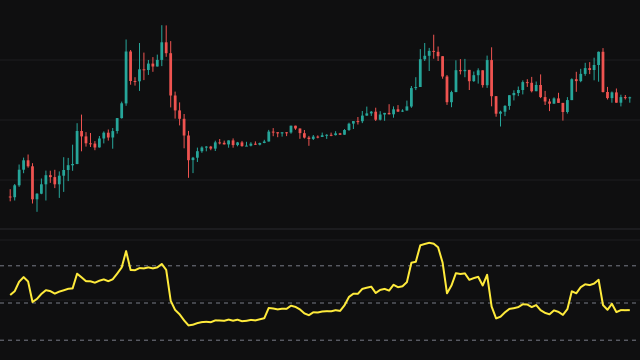
The Derivative Oscillator (DOSC) starts from an RSI of the source (14 bars by default). It smooths that RSI twice with exponential averages (5 and then 3 bars), each starting from its first input, and then subtracts a simple average of the double-smoothed line (9 bars) used as a signal line. The plotted value is the gap between the smoothed RSI and that signal line.
The RSI here treats the bar before the first as a price of zero, and until the RSI period has passed its averages are simply the current bar's gain and loss; after that they are smoothed with weight one over the period. The signal average uses the bars it has while its window fills, so the oscillator is drawn from the first bar.
How to read Derivative Oscillator (DOSC)
Above zero, the double-smoothed RSI sits above its own recent average, so momentum has been improving. Below zero it sits under that average, so momentum has been weakening. Crossings of the zero line are the main event: a cross up suggests momentum has turned higher and a cross down that it has turned lower. A shrinking distance from zero shows the current swing in momentum losing strength.
The opening bars are dominated by the warmup and should be ignored. Like any momentum measure it can cross back and forth in a flat market.
Settings
- Source
- The price series the calculation reads, such as the close or the bar midpoint.
- RSI Period
- Length of the RSI the oscillator is built from.
- EMA1 Period
- Length of the first exponential smoothing applied to the RSI.
- EMA2 Period
- Length of the second exponential smoothing, applied to the first.
- Signal Period
- Length of the simple average used as the signal line that is subtracted.
Frequently asked questions
What does a cross above zero mean?
The double-smoothed RSI has moved above its own recent average, which means RSI momentum has turned upward.
Why are the first bars so extreme?
The bar before the first counts as a price of zero, so the first change is a full-size gain and the RSI starts at 100. The smoothing works that start out over the following bars.
Is it the same as an RSI?
No. It is built from an RSI but shows how far the smoothed RSI sits from its own average, so it centres on zero rather than 50 and its sign shows whether that smoothed RSI is above or below its recent mean.