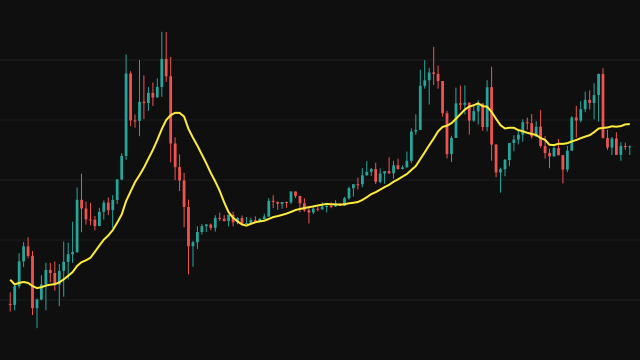
The cumulative mean is the plain average of every value of the source seen so far. On each bar the study adds the value to a running total, counts it, and plots the total divided by the count. A bar with no value is skipped rather than counted as zero, and the line starts on the first bar that has a value.
Unlike a moving average, nothing ever leaves the window: the first bar of the chart weighs exactly as much as the latest. Each new bar moves the mean by its difference from the mean divided by the number of bars seen, so the line moves less and less as the chart grows.
How to read Cumulative Mean (CUMMEAN)
Read the line as the average price across the whole loaded history. Price above it has been trading above that long-run average, and price below it below. Early in the chart the line follows price closely; later it flattens into a baseline.
Because it depends on where the chart starts, the value changes when more or less history is loaded, and it reacts very slowly to a new trend. Use it as a reference level, not as a signal line.
Settings
- Source
- The price series averaged, the close by default.
Frequently asked questions
Why does the line hardly move late in the chart?
Each new bar shifts the mean by its distance from the mean divided by the number of bars so far. After a thousand bars, a new bar moves it only a thousandth of that distance.
Why does the value change when I load more history?
The average covers every loaded bar from the first one. Starting the chart earlier adds older prices to the average, so the whole line shifts.