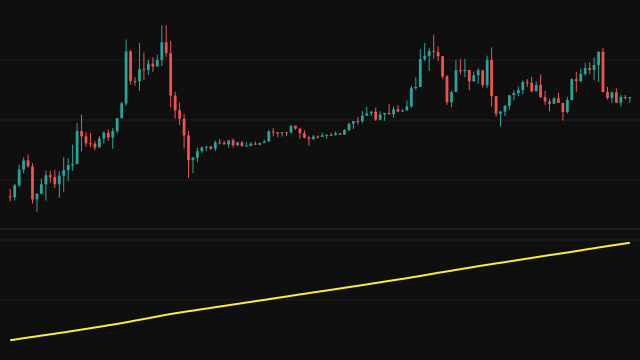
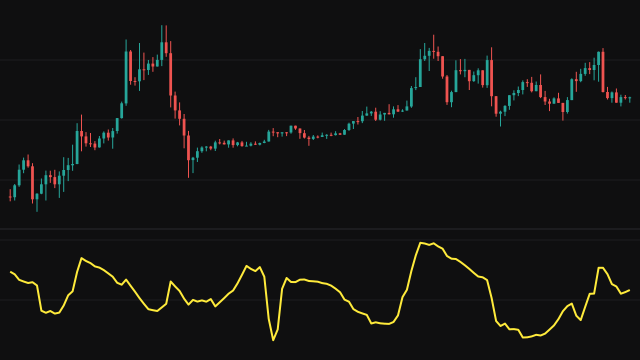
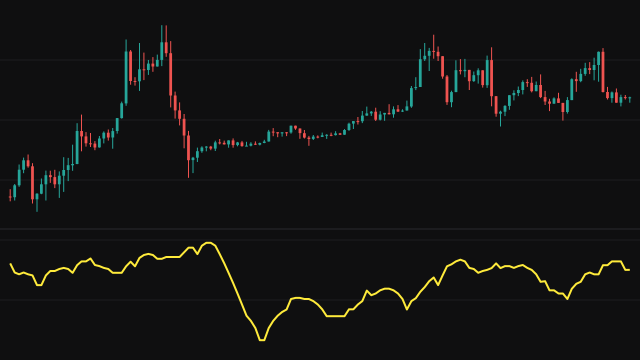
Covariance measures how two series move together. Over the last Period bars the study keeps running totals of each series and of their product, counting only the bars where both have a value. The covariance is the mean of the products less the product of the two means, the population form.
The window is allowed to be partly filled, so the study answers from the second bar over however many bars it holds so far, and once the window is full the oldest pair leaves as each new one arrives. Both series are read from the same instrument, by default the close as Source 1 and the open as Source 2.
How to read Covariance (COVARIANCE)
A positive value means the two series have tended to sit above their averages together and below them together; a negative value means one has tended to be high when the other is low. A value near zero means no consistent linear relationship over the window.
Covariance is in the units of the two series multiplied together, so its size grows with price and volatility and cannot be compared across instruments. For a scale-free reading of the same relationship, use correlation, which divides covariance by both standard deviations.
Settings
- Source 1
- The first price series of the pair, the close by default.
- Source 2
- The second price series of the pair, read from the same instrument, the open by default.
- Period
- The number of bars in the rolling window. A longer period gives a smoother line that reacts more slowly.
Frequently asked questions
Why is the value so large?
Covariance is measured in price times price. On an instrument quoted in the tens of thousands, even a modest joint move gives a large number. Watch its sign and changes rather than its size.
Why does it start on the second bar?
The window may be partly filled, and the study answers as soon as it holds two pairs. The earliest values rest on few bars and settle once the window is full.