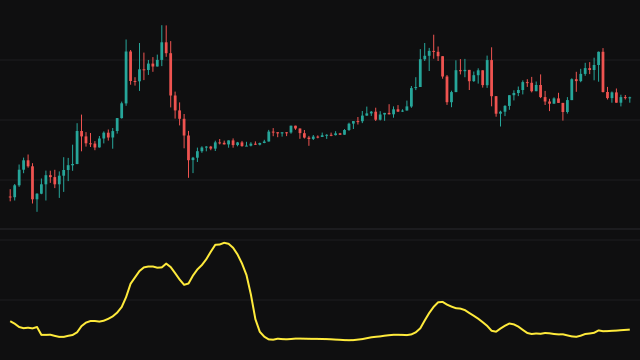
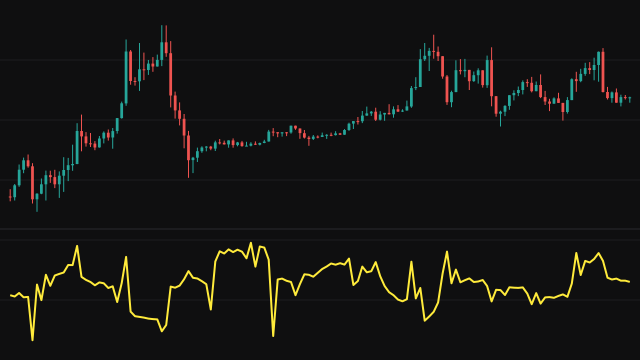
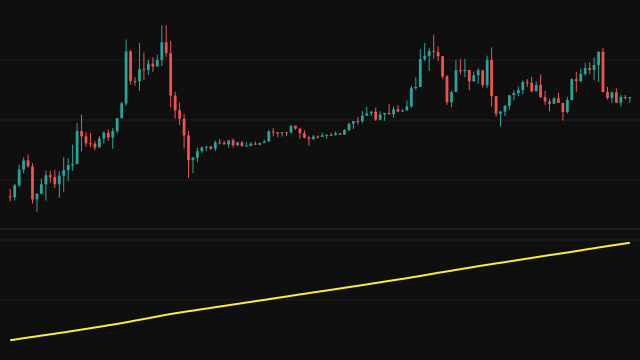
The study measures how closely two series move together in a straight-line relationship. It keeps running sums of each series, their squares and their product over the last Period bars, then divides the covariance of the two by the product of their standard deviations. The result is +1 when the series rise and fall together in fixed proportion, -1 when one rises exactly as the other falls, and near 0 when their moves are unrelated.
Both series come from the chart's own symbol: by default the close and the volume. A bar enters the window only when both values are present. The coefficient appears as soon as two pairs are held and grows to the full window from there. When either series is flat over the window there is no defined correlation and the bar is left blank.
How to read Pearson's Correlation (CORRELATION)
With the default inputs, a positive reading means bars with a higher close have also tended to carry higher volume over the window, and a negative reading means the heavier volume came with the lower closes. Readings near zero mean no consistent link.
Correlation measures a straight-line relationship only, and over a short window it swings widely. It says nothing about which series leads, and a strong reading over a few bars can be chance. Use a longer period for a steadier picture.
Settings
- Source 1
- The first series of the pair, the close by default.
- Source 2
- The second series of the pair, taken from the same symbol, volume by default. The menu lists only price series, so volume is available only as this default.
- Period
- How many recent bars the correlation is measured over. A longer period gives a steadier reading.
Frequently asked questions
Can it compare two different instruments?
No. Both series come from the symbol on the chart, so it compares two series of one instrument, such as its close and its volume.
Why is the line blank on some bars?
When one of the series did not change at all over the window, its standard deviation is zero and the correlation is undefined, so nothing is drawn.
What counts as a strong correlation?
Readings beyond about plus or minus 0.7 are usually called strong and readings inside plus or minus 0.3 weak, but over a short window even a strong reading can be chance.