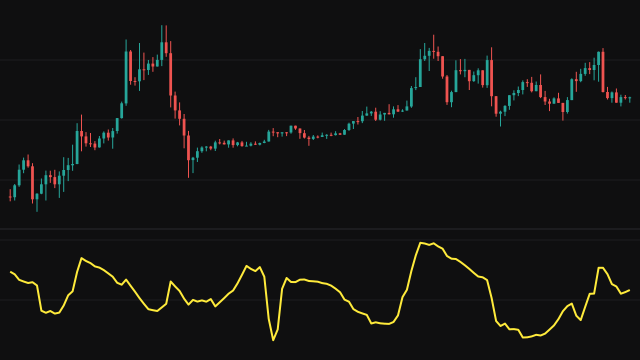
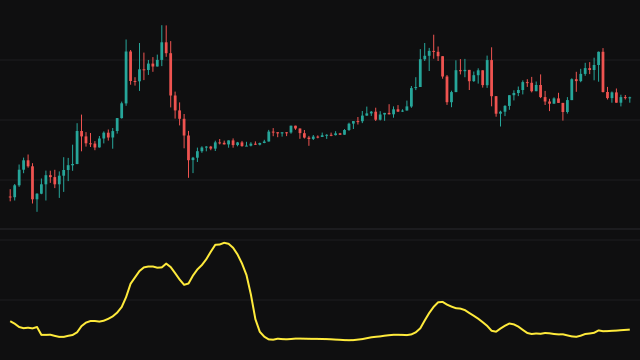
Cointegration asks whether two series that wander on their own keep a stable relationship, so that the spread between them keeps returning to an average. This study measures that over a rolling window. It first fits series A against series B: the hedge ratio is their correlation times the ratio of their standard deviations, the intercept lines up their means, and the residual is what is left of A once that fit is taken away.
It then runs a simple regression of the change in the residual on its previous value over one bar fewer than Period. The slope of that regression, divided by its standard error, is the plotted statistic, the same form as the standard unit-root test for mean reversion. The rolling statistics answer from the first bars over however many values the window holds so far, instead of waiting for it to fill, so the line starts early and settles once the window is full.
Both series are read from the same instrument, by default the close as series A and the open as series B.
How to read Cointegration (COINTEGRATION)
A strongly negative value means the spread has tended to snap back after moving away, which is the behaviour of a cointegrated pair. A value near zero means the spread has drifted with no pull back to its mean. As a rough guide, unit-root tests treat values below about -3 as strong evidence of mean reversion, but this rolling version has no exact critical values.
The statistic is noisy over short windows and on an hourly chart. Read it as a description of the recent window, not as a forecast, and look for it to stay negative for a while before trusting a mean-reversion reading.
Settings
- Source 1
- Series A, the series regressed on series B. The residual is measured in its units.
- Source 2
- Series B, the second price series of the pair, read from the same instrument.
- Period
- The number of bars in the rolling fit. The residual regression runs over one bar fewer. A longer period gives a steadier statistic.
Frequently asked questions
Can I compare two different instruments?
Not in this study: both series are read from the chart's own instrument, so it compares two price series of the same instrument, by default the close and the open.
Why does the line start on the first bars instead of after a full window?
The rolling means, deviations and correlation answer over however many bars the window holds so far. The early values rest on very few bars and should be ignored until the window has filled.
What value counts as cointegrated?
More negative is stronger. Values below about -3 are commonly read as strong mean reversion, but the threshold is a guide rather than an exact test level for this rolling form.