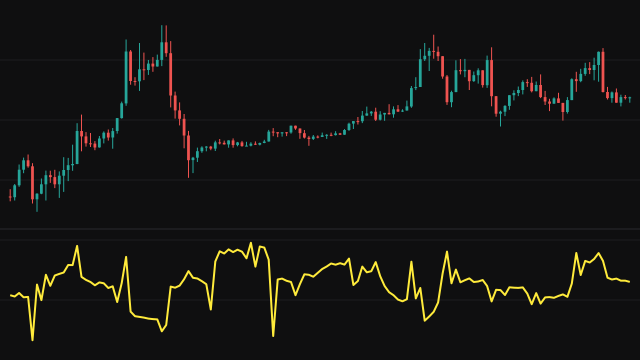
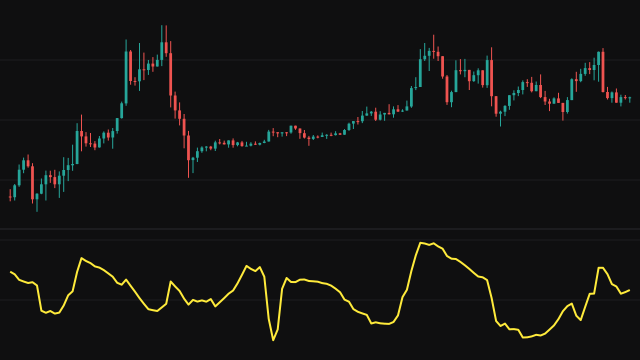
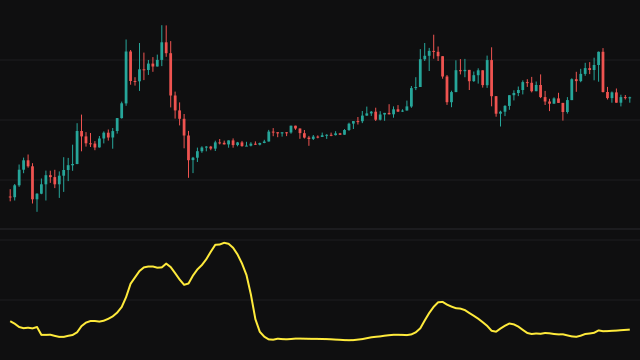
The Cumulative Moving Average is the plain arithmetic mean of every source value from the first bar on the chart up to the current bar. There is no period to choose: each new bar is added to the sample and nothing ever leaves it.
The study keeps the mean as a running figure and updates it in place on each bar: the new mean is the old mean plus the difference between the new value and the old mean, divided by the number of bars seen. This gives the same answer as summing every value and dividing by the count, without holding the whole history. A bar with no source value is counted with the current mean in its place, so it leaves the line unchanged.
Because every bar carries the same weight, the line moves quickly over the first few bars and then flattens as the sample grows. Late in a long chart a single new bar barely moves it.
How to read Cumulative Moving Average
Read the line as the average price of everything loaded on the chart to date, not as a trend follower. Price above the line means the market is trading above its average for the whole sample, and price below it means the opposite. The distance between price and the line shows how far the market has travelled from that long-run centre.
The value depends on where the chart starts. Loading more history, or a different start date, gives a different line, so compare readings only on charts that begin at the same bar. On a long chart the line reacts very little to recent moves.
Settings
- Source
- The price series that is averaged, such as the close or the bar midpoint.
Frequently asked questions
Why does the line hardly move late in the chart?
Every bar has equal weight, so after a thousand bars a new bar changes the mean by about a thousandth of its distance from the line. The longer the sample, the flatter the line.
Why does the line change when I load more history?
The average starts at the first bar on the chart. A different first bar means a different sample, so the whole line shifts.
How is this different from a simple moving average?
A simple moving average drops old bars once its window is full. The cumulative average never drops anything, so it measures the whole chart rather than the recent past.