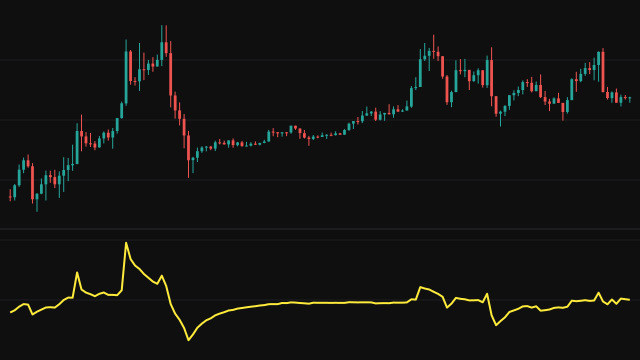
Ease of Movement asks how much volume it took to move price. For each bar it takes the change in the bar's midpoint, the average of high and low, against the previous bar's midpoint. It then builds a box ratio: the bar's volume divided by the Smoothing setting, divided by the bar's range. The raw value is the midpoint change divided by that box ratio, so a wide move on light volume gives a large reading and a small move on heavy volume gives one near zero.
A bar with no range or no volume contributes zero, and the first bar compares with itself, so its change is zero. The raw values are averaged with a simple mean over the Period window. During the first bars the mean covers however many bars have arrived, so the line starts on the first bar instead of waiting for the window to fill.
Note that the two settings do different jobs than their names suggest: Period is the averaging window and Smoothing is the divisor applied to volume.
How to read Ease of Movement (EOM)
Above zero, the midpoint has been rising with relatively little volume behind it, which reads as price moving up easily. Below zero, it has been falling easily. Readings close to zero mean price is moving little for the volume traded, a sign of effort without progress.
The scale depends on the instrument's volume and on the Smoothing divisor, so compare readings on the same chart rather than across symbols. A cross of the zero line is the usual signal, and it lags the price turn by part of the averaging window.
Settings
- Period
- The number of bars in the simple mean of the raw values. A longer window gives a smoother, slower line.
- Smoothing
- The divisor applied to volume in the box ratio. A larger value shrinks the box ratio and scales every reading up by the same factor; the shape of the line does not change.
Frequently asked questions
Why does the line start on the first bar instead of after the window fills?
The mean divides by the number of bars seen until the window is full, so the first readings are averages of fewer bars rather than blanks.
What happens on a bar with zero range?
The box ratio cannot be formed, so that bar adds zero to the average rather than a division by zero.
Why are the values so small or so large on some symbols?
The reading is a price change divided by volume per unit of range, so its size follows the symbol's volume. Change the Smoothing divisor to rescale it, or compare it only with its own history.