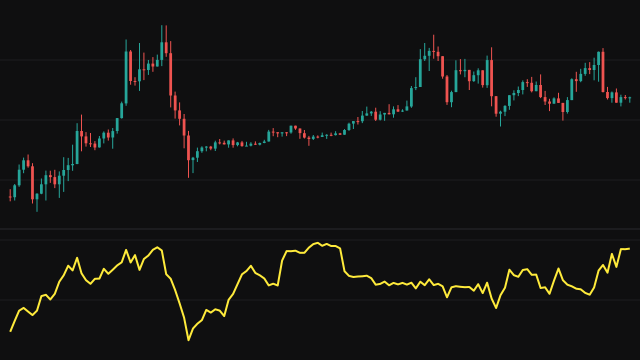
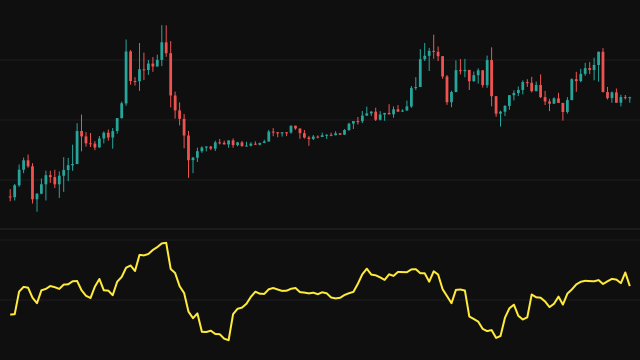
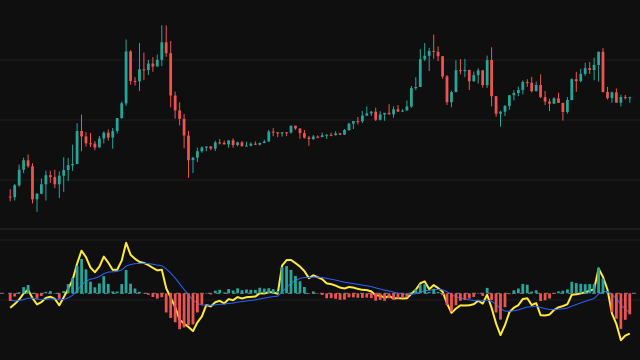
The Elastic Volume Weighted Moving Average is drawn on the price chart. It keeps a running total of the volume traded over the last Period bars. On each bar the previous average is weighted by the window's volume minus this bar's volume, the current price is weighted by this bar's volume, and the sum is divided by the window's volume.
The effect is that the line moves toward price by the fraction of recent volume that this bar carries. A bar with a large share of the window's volume pulls the average most of the way to price; a bar with little volume leaves it almost where it was. The average starts at the first bar's price, and while the window is still filling it uses the volume of the bars seen so far. A window with no volume at all holds the line flat.
How to read Elastic Volume Weighted Moving Average (EVWMA)
Read it like any moving average: price above a rising line is an uptrend, price below a falling line a downtrend. The difference is in how it reacts. It jumps on high-volume bars and stalls on quiet ones, so a breakout on heavy volume pulls it along quickly while a drift on thin volume hardly moves it.
Because the speed comes from volume rather than from a fixed weight, the line can sit still for a while and then catch up in a few bars. It needs real volume; on a series without volume it simply holds its first value.
Settings
- Period
- The number of bars whose volume forms the window. A longer window makes each bar's share smaller, so the line moves more slowly.
- Source
- The price series the average follows, the close by default.
Frequently asked questions
How is this different from a volume weighted moving average?
A volume weighted moving average recomputes a weighted mean of the window every bar. This line carries its previous value forward and only steps toward price by this bar's share of the window's volume.
Why does the line sometimes stay flat?
A bar with no volume has no share of the window, so it does not move the average. On a series without volume the line holds its starting value.