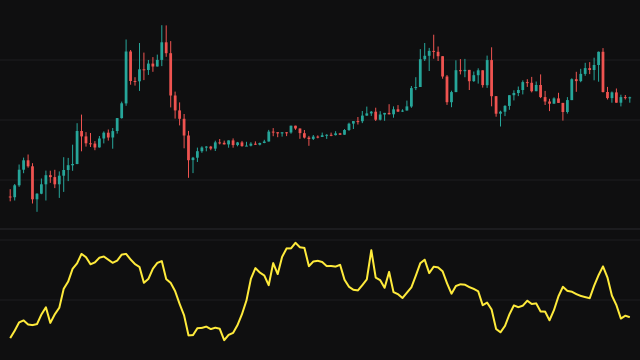
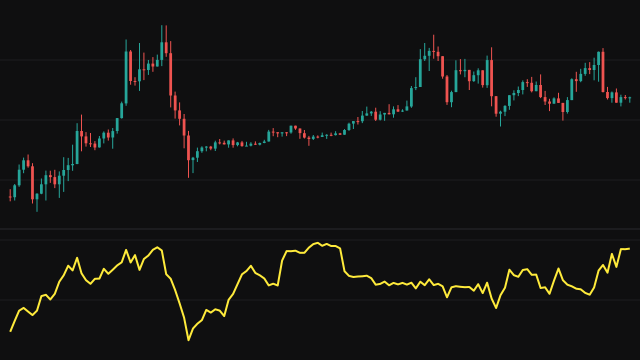
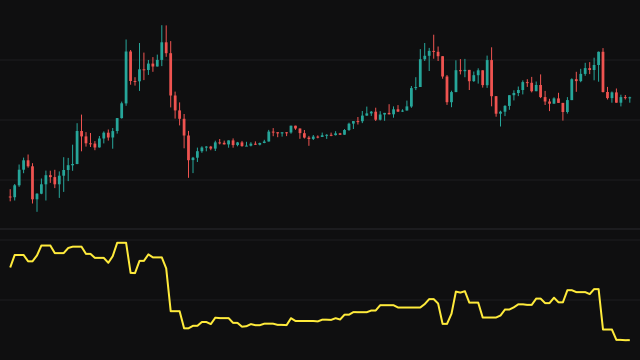
The Klinger Volume Oscillator turns volume into a signed force and compares its short-term and long-term flow. The trend is +1 while the typical price, (high + low + close) / 3, is rising against the previous bar and -1 while it is falling; an unchanged bar keeps the previous trend. The bar's volume is multiplied by that trend and by a weight taken from where the close sits in the bar's range (0 when the close is exactly mid-range, 1 when it is on the high or the low), giving the volume force. A bar with no range carries no force.
The force is smoothed by a fast and a slow exponential mean, and the KVO line is the fast mean minus the slow one. A signal line is an exponential mean of the KVO line, and the histogram is the KVO line minus the signal, drawn green at or above zero and red below. Each mean starts from zero and is divided by one minus its decayed seed weight during the early bars, so the lines read true from the first bar.
How to read Klinger Volume Oscillator (KVO)
A KVO line above zero means the short-term flow of volume force is stronger than the long-term flow in the up direction; below zero, in the down direction. The usual signals are the KVO line crossing its signal line, shown by the histogram changing colour, and the KVO line crossing the zero line.
Divergence is the other common reading: price making a new high while the KVO line makes a lower one suggests the volume behind the move is fading. The values are in units of volume, so compare them only with the oscillator's own history on the same symbol.
Settings
- Fast EMA Period
- The length of the fast exponential mean of volume force. A shorter value makes the KVO line react faster.
- Slow EMA Period
- The length of the slow exponential mean that the fast one is measured against. A longer value sets a steadier baseline.
- Signal Line Period
- The length of the exponential mean of the KVO line that forms the signal line and, with it, the histogram.
Frequently asked questions
What does the histogram colour mean?
Green when the KVO line is at or above its signal line, red when it is below. A change of colour is a crossing of the two lines.
Why does the trend not change on a flat bar?
The trend only flips when the typical price rises or falls. A bar with the same typical price as the one before keeps the previous direction.
Why are the early values not pulled toward zero?
Each exponential mean starts at zero, and during the early bars it is divided by a correction that removes the effect of that start.