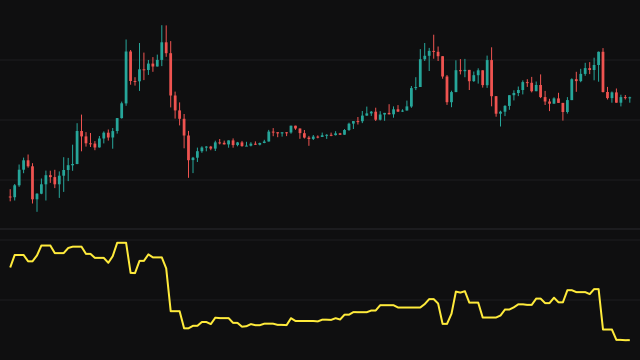
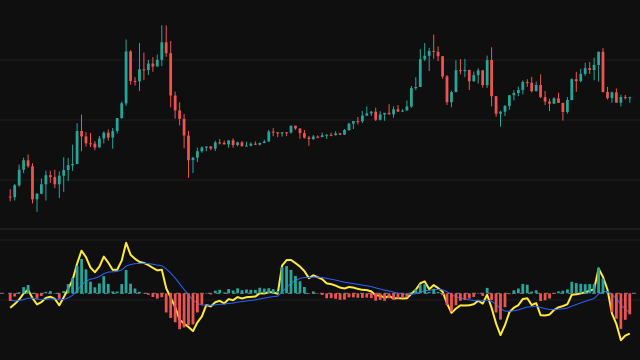
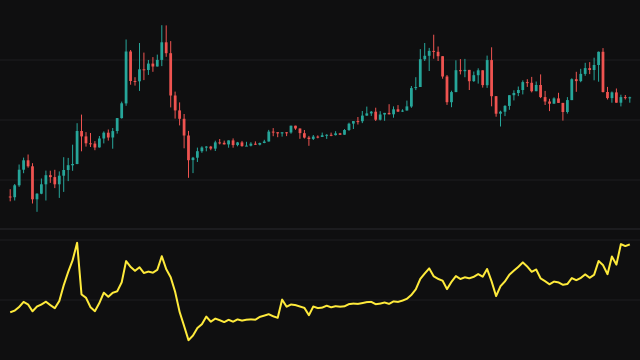
The Money Flow Index measures buying and selling pressure with both price and volume. Each bar's raw money flow is its typical price, (high + low + close) / 3, times its volume. When the typical price is higher than on the previous bar the flow counts as positive, when it is lower it counts as negative, and when it is unchanged it counts as neither. The first bar compares with itself and counts as neither.
The positive and negative flows are summed over the last MFI Period bars, using however many bars have arrived until the window fills. The money ratio is positive flow divided by negative flow, and the index is 100 - 100 / (1 + ratio). When the window holds no negative flow at all, the ratio is taken as zero, so the index reads 0 on those bars rather than 100.
How to read Money Flow Index (MFI)
High readings mean most of the recent money flow came on rising bars; low readings mean it came on falling bars. Many traders treat readings above 80 as stretched to the upside and below 20 as stretched to the downside, and watch for the index to turn back from those zones.
Divergence is the other use: price making a new high while the index makes a lower one suggests the volume behind the advance is fading. Keep in mind the special case: a window with no falling bars reads 0, not 100, which can happen early in the series or with a very short period.
Settings
- MFI Period
- The number of bars over which positive and negative money flow are summed. A shorter period reacts faster and reaches the extremes more often.
Frequently asked questions
Why does the index sometimes drop to 0 during a strong rise?
When every bar in the window rose, there is no negative flow and the ratio is taken as zero, so the index reads 0 rather than 100. Watch for this with short periods.
How is this different from an RSI?
An RSI compares the size of up and down price changes. This index weights each bar by typical price times volume, so a move on heavy volume counts for more.
Does the index wait for the window to fill?
No. The sums cover however many bars have arrived, so it answers from the first bar.