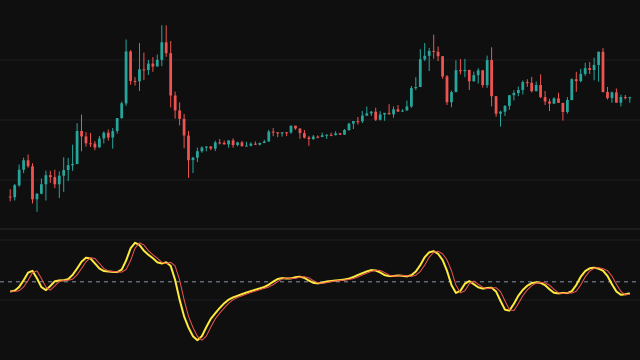
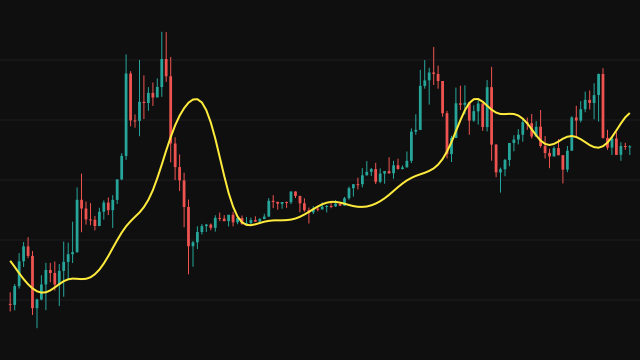
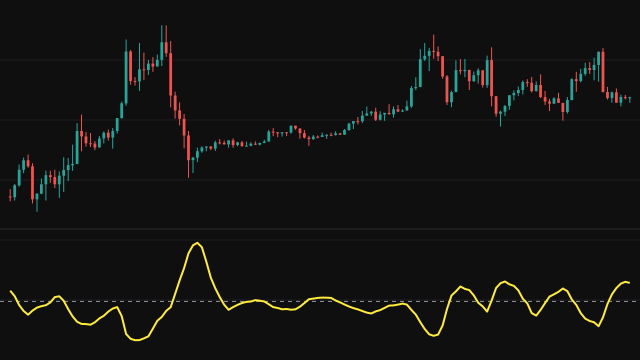
The Correlation Cycle asks how closely recent price resembles a pure wave of a given length. Over the last Period bars it computes the Pearson correlation of price with one full cycle of a cosine (the Real line) and with one full cycle of a negative sine (the Imag line). Each correlation runs from -1 to +1 and is drawn multiplied by 100. Before enough history exists, missing bars in the window are filled with the current price.
The two correlations form a phasor, and the study also tracks its angle in degrees, not allowed to step backward, and a market state from how fast that angle changes. A change smaller than the State Threshold reads as a trend, up when the angle is at or above zero and down when it is at or below zero. As in the indicator this study reproduces, the angle and the state are computed but not drawn. On the very first bar the window holds one price repeated, the correlation is zero over zero, and the study leaves that bar blank.
How to read Ehlers Correlation Cycle (CCOR)
When the market cycles at roughly the chosen period, Real is near +100 around swing highs and near -100 around swing lows, and Imag runs a quarter cycle ahead of it. Real crosses above Imag while price is rising toward a high and below it while price is falling toward a low. The Real line is green while it is above Imag and red otherwise, so a colour change marks a crossing.
When the lines flatten and stop crossing, price no longer looks like a wave of that length, which usually means a trend. The correlations measure shape, not size, so a tiny range can still produce full-scale readings.
Settings
- Period
- The length in bars of the reference cosine and sine waves, the cycle length the study looks for.
- State Threshold (degrees)
- The angle change per bar below which the market state reads as trending. It feeds the computed state, which is not drawn.
- Source
- The price series that is correlated with the reference waves. The default is the close.
Frequently asked questions
Why is the first bar blank?
On the first bar every price in the window is the same, so the correlation divides zero by zero. Any number there would be rounding noise, so the study draws nothing on that bar.
Why are there no state or angle lines?
The calculation tracks the phasor angle and a trend or cycle state, but neither is drawn, matching the indicator this study reproduces. The State Threshold only affects that hidden state.
What period should I use?
Use the cycle length you expect on your chart. If the lines cross cleanly and regularly, the period is close to the market's own rhythm; if they drift and rarely cross, try another length.