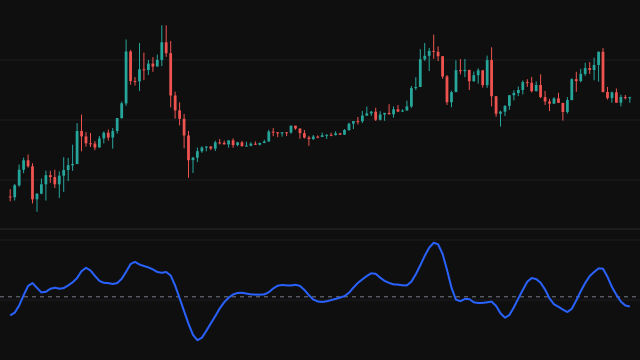
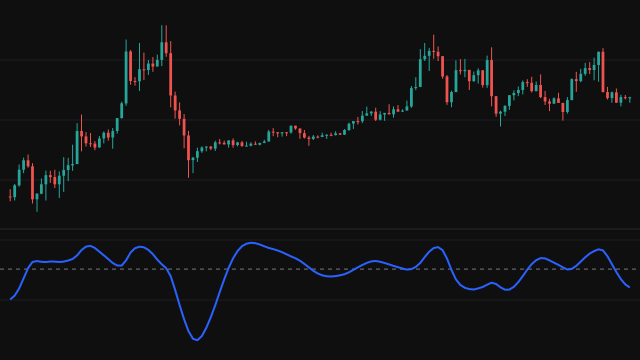
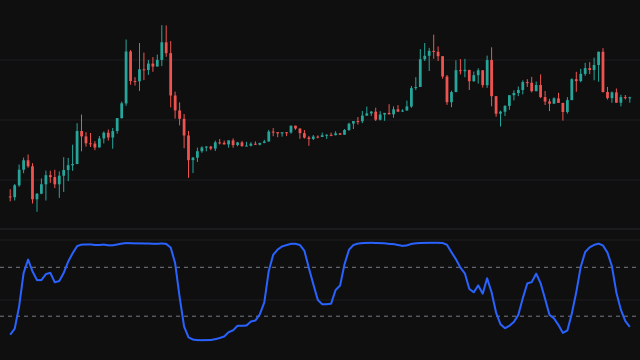
The oscillator starts from the change in the source over two bars. That difference has no response to a flat trend or to the fastest bar-to-bar flicker, so it is centred on zero without adding lag. A two-pole super smoother, with its cutoff at half the Period, then removes the remaining noise.
The smoothed value is divided by its own root mean square over the last Period bars (40 by default). That expresses each reading in standard deviations, so the scale is the same on any instrument and in quiet or busy markets. This step is John Ehlers' deviation-scaled oscillator.
Finally the scaled value is halved and passed through the Fisher transform, 0.5 * ln((1 + x) / (1 - x)), which stretches values near the edges. Halving puts two deviations at the edge of the transform, so, as in Ehlers' definition, only a scaled value strictly inside plus or minus two deviations is transformed. On a bar beyond that, or one whose window has no movement at all, the line keeps its previous reading. The result is drawn as a line around a dashed zero line.
How to read Ehlers Fisherized Deviation-Scaled Oscillator (FDSO)
Most of the time the line stays within about plus and minus one. Because the Fisher transform stretches the tails, a swing well beyond that stands out clearly and marks an unusually strong move relative to the recent window, often near the end of a swing. A turn back toward zero from such an extreme is the usual reading of a reversal, and a crossing of zero shows the smoothed momentum changing side.
The scale adapts to recent volatility, so after a long quiet stretch a modest move can read as extreme. It is a momentum and cycle tool, not a trend filter, and in a strong trend it can sit at one side for many bars.
Settings
- Source
- The price series the two-bar change is taken from. Close is the default.
- Period
- Bars in the root mean square window; the smoother's cutoff is half of it. Larger values give a slower, steadier line.
Frequently asked questions
Why apply a Fisher transform to an oscillator?
Price swings rarely follow a bell curve. The transform reshapes the scaled readings so their spread is closer to a normal distribution, which makes the extremes sharper and easier to tell apart from ordinary swings.
What does a reading of 1 mean?
Roughly that the smoothed momentum is about one and a half standard deviations of the recent window from zero. The transform is not linear, so readings grow quickly as the scaled value nears two deviations.
Why does the line sometimes stay flat for a bar or two?
The Fisher transform is undefined once the halved value reaches -1 or 1, that is at two deviations. Following Ehlers' definition, a bar at or beyond two deviations is not transformed and the line keeps its previous reading until the scaled value comes back inside the range.