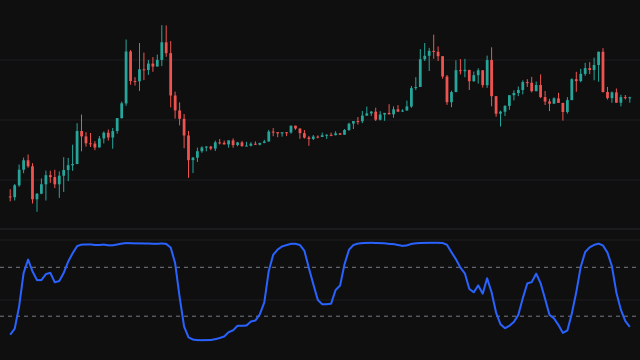
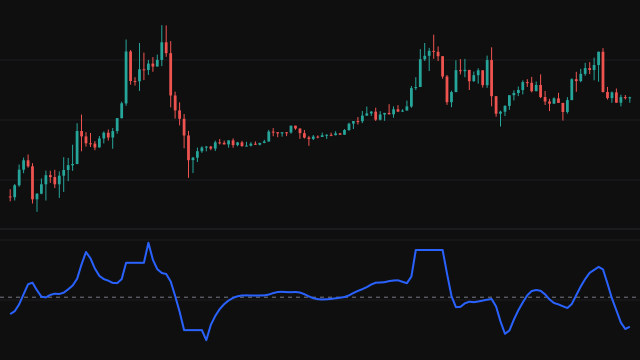
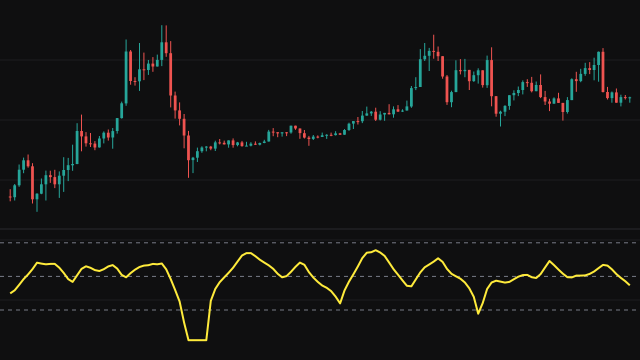
The Elegant Oscillator is John Ehlers' answer to the question of how to turn momentum into a bounded, smooth swing with very little lag. It starts from the change in the source over two bars, which is centred on zero and ignores the slow trend.
That change is divided by its root mean square over the last RMS Length bars (50 by default), so it is measured in standard deviations of recent movement and means the same in quiet and busy markets. The inverse Fisher transform, (exp(2x) - 1) / (exp(2x) + 1), then squeezes it into the range -1 to 1: small values pass almost unchanged, while large ones are soft-clipped toward the edges rather than cut off.
Last, a two-pole super smoother with its cutoff at Band Edge bars (20 by default) smooths the result. The oscillator is drawn as a line around a dashed zero line.
How to read Ehlers Elegant Oscillator
The line swings between about -1 and 1. Readings near the edges mean the recent move is large compared with the window's usual movement, and because the inverse Fisher transform flattens the extremes, the line tends to sit near an edge briefly and then turn decisively. A turn down from near 1 or up from near -1 is the usual reversal reading, and a crossing of zero shows momentum changing side.
The smoother adds a little lag, so the turns come a few bars after the price turn. In a strong steady trend the line can hold near one edge for a long time, which is a sign of strength rather than of a reversal.
Settings
- Source
- The price series the two-bar change is taken from. Close is the default.
- Band Edge
- The cutoff period of the final smoother. Larger values give a smoother, slower line.
- RMS Length
- Bars in the window the change is normalized by. Longer windows make the scale steadier; shorter ones adapt faster to changing volatility.
Frequently asked questions
Why use the inverse Fisher transform here?
It squeezes any value into -1 to 1 without a hard cut. Ordinary swings pass almost unchanged while large ones bend smoothly toward the edges, which gives clear, bounded turning points.
Why divide by the root mean square?
It puts the change in units of recent typical movement, so the same reading means the same thing on any instrument and at any volatility.
When does the line first appear?
Once the normalizing window is full: by default after about 52 bars, the two bars of the change plus the 50 bar window.