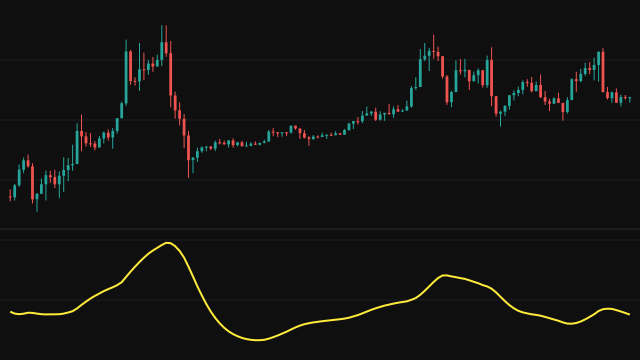
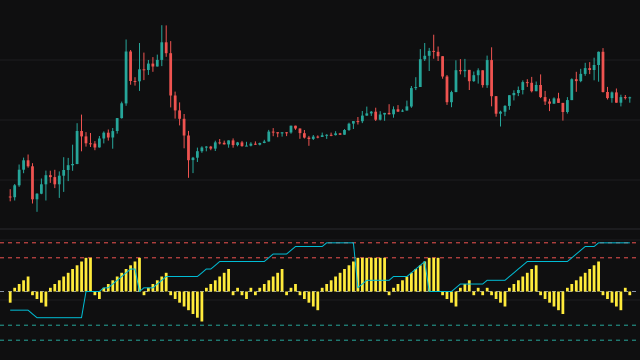
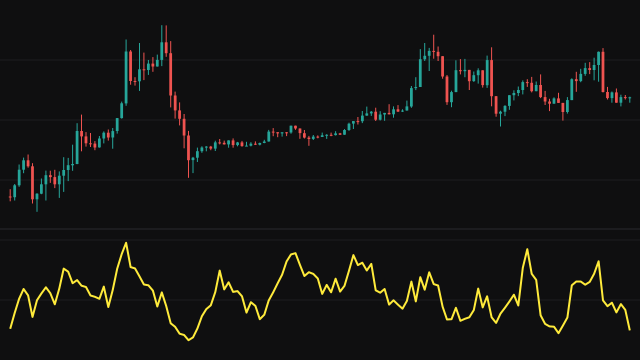
TRENDFLEX measures how strongly a smoothed price is moving in one direction. The source is first passed through a two-pole smoothing filter tuned to half the period. On the first two bars the filter passes the price straight through.
On each bar the study adds up the distance from the filtered value now to each of its last values over the period (fewer on the opening bars, while the history is still short) and divides by the period. When the filtered price has been rising, all those distances are positive and the sum is large; when it has been falling, the sum is large and negative.
That sum is then divided by the square root of an exponential mean of its own square, with a weight of 0.04, so the output reads in units of its own recent spread and the same levels mean the same thing on any instrument. A missing source value enters the filter as zero and is blanked on the plot.
How to read Ehlers Trendflex Indicator (TRENDFLEX)
Above zero the smoothed price sits above where it has been over the period, which is an uptrend; below zero it is a downtrend. The further from zero, the more one-sided the move compared with recent behaviour. A turn back toward zero shows the trend losing strength, and a crossing of zero shows it changing direction.
Because the output is scaled by its own recent spread, a long quiet spell can make a modest move read large. Use the period to match the length of trend you care about: short periods follow swings, long periods follow the broader move.
Settings
- Period
- The number of bars the distances are measured over. The smoothing filter is tuned to half of it.
- Source
- The price series the filter reads. A missing value enters the filter as zero.
Frequently asked questions
How is this different from a cycle oscillator on the same filter?
This one compares the filtered value with each past value directly, so a steady trend gives a steady positive or negative reading. A cycle oscillator compares it with a straight line through the window, which removes the trend.
Why does the line open at zero and then near plus or minus 5?
On the first bar there is no earlier filtered value, so the sum is zero. On the second bar the mean square, which starts from zero, holds only 0.04 times the first sum squared, so the sum divided by its square root is plus or minus 5. The opening bars are a settling stretch until the mean square has built up.
Is there an overbought level?
There is no fixed one. The output is scaled by its own recent spread, so readings beyond about plus or minus one are stronger than usual, but how far they can run depends on the market.