The Elliott Wave Oscillator measures momentum as the distance between a fast and a slow simple moving average of the source: by default 5 bars and 35 bars of the close. With Show Dif as percent of current Candle on, the gap is divided by the source and shown as a percentage, so readings compare across instruments and price levels; with it off, the gap is shown in price.
The result is drawn as a histogram in its own pane: green while the fast average is above the slow one and red while it is at or below it.
How to read Elliott Wave Oscillator
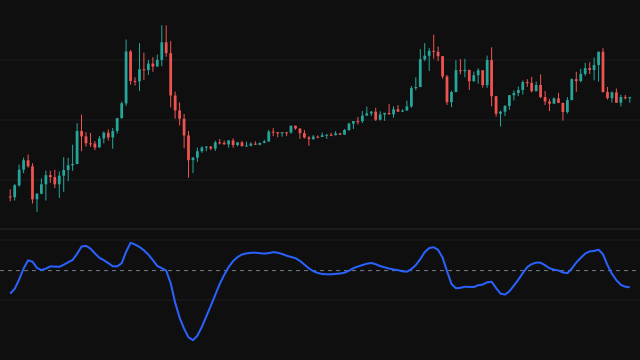
Bars above zero mean the recent average is above the longer one, an upswing; bars below zero a downswing. The height shows how strong the move is, so a new high in price on a lower histogram peak is a sign the swing is tiring, and traders who count waves use the tallest peak in a run to mark the strongest leg.
The colour changes on the zero crossing, which lags the turn in price by a few bars, and in a sideways market the histogram hovers around zero and flips often.
Settings
- Source
- The price series both averages are taken over. Close is the default.
- Fast Length
- Bars in the fast simple average. 5 is the usual value.
- Slow Length
- Bars in the slow simple average. 35 is the usual value.
- Show Dif as percent of current Candle
- Show the gap as a percentage of the source instead of in price, so readings compare across instruments.
Frequently asked questions
Why use a percentage rather than price?
A gap of 100 means a lot on one instrument and very little on another. As a percentage of price the readings mean the same on any instrument and at any price level.
When does the colour change?
When the gap crosses zero: green while the fast average is above the slow one, red while it is at or below it.
Do I need to count waves to use it?
No. It works as a plain momentum oscillator; the wave reading is one way to use it, not a requirement.