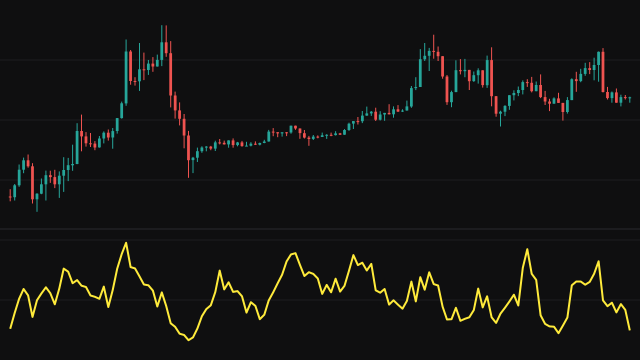
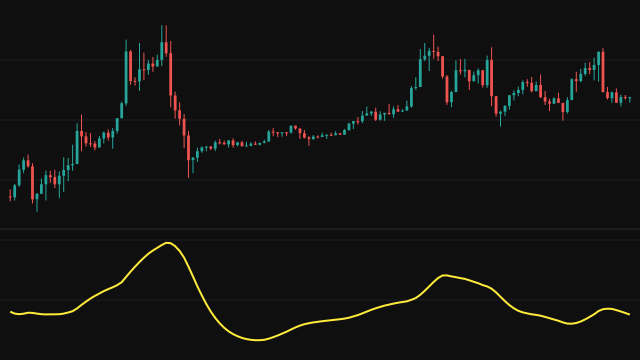
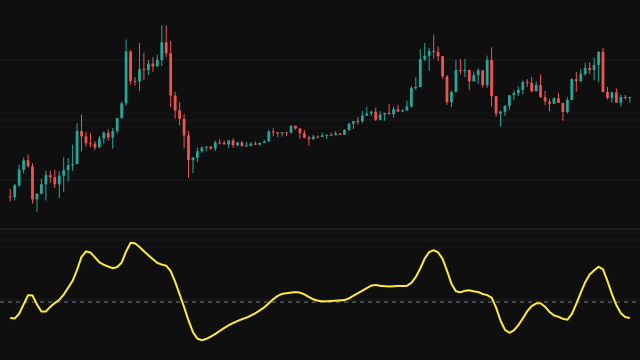
Williams %R measures the close against the range of the last period bars. It takes the highest high and the lowest low of that window and reports how far the close sits below the top: -100 * (highest high - close) / (highest high - lowest low). A close at the top of the range reads 0, a close at the bottom reads -100, and a close in the middle reads -50.
The window starts from the first bar and grows until it holds period bars, so the line answers from bar 0 rather than waiting for a full window. When the range is zero, because every high and low in the window is equal, there is no top or bottom to measure from and the study reads -50.
How to read Williams %R (WILLR)
Readings near 0 mean the close is pressing against the top of its recent range, and readings near -100 mean it is pinned at the bottom. Many traders treat the band from 0 to -20 as overbought and from -80 to -100 as oversold, and watch for the line to leave those zones as a sign that the push has stalled.
In a strong trend the line can stay at an extreme for a long time, so an overbought reading is not by itself a reason to sell. The first bars of the chart use a shorter window and move more sharply than later ones.
Settings
- Period
- How many bars the high and low range covers. A shorter period makes the line swing faster between 0 and -100; a longer one smooths it.
Frequently asked questions
Why is the scale negative?
It measures the distance from the top of the range. A close at the top is 0 distance away, and a close at the bottom is the whole range away, written as -100.
Why does the line start on the first bar?
Until the window holds a full period bars, it uses every bar so far. The early readings are measured against a shorter range and swing more sharply.
What does a reading of exactly -50 mean?
Usually that the close is in the middle of its range. It is also what the study shows when the range is zero, since there is no top or bottom to measure from.