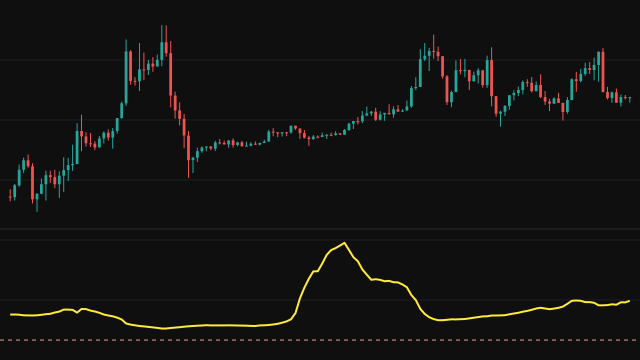
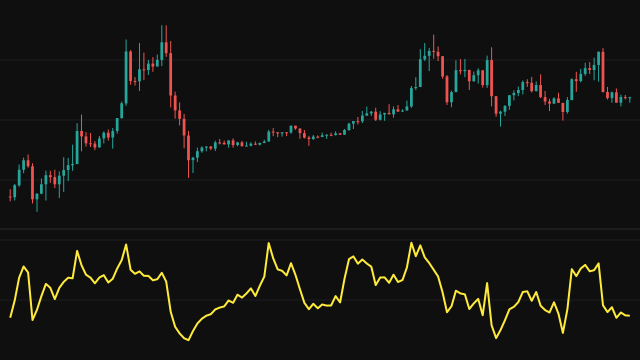
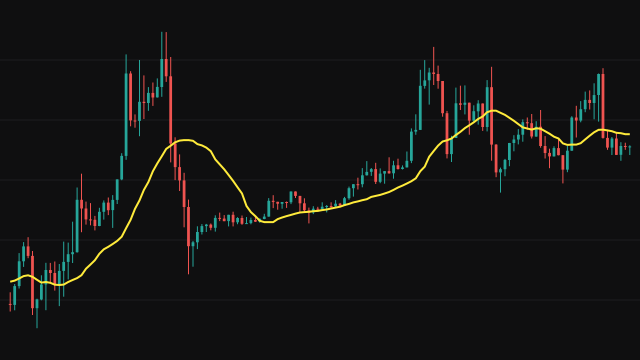
The Fractal Dimension Index estimates how jagged the recent price path is, using the waveform method published by Carlos Sevcik. The last length values of the source (30 closes by default) are mapped onto a unit square: time runs from 0 to 1 in equal steps, and price is rescaled so the window's lowest value is 0 and its highest is 1.
The study then adds up the lengths of the straight segments that join the rescaled points into a total path length L, and computes FDI = 1 + (ln L + ln 2) / ln(2 * (length - 1)). Sevcik's own estimate is 1 + ln L / ln(2 * (length - 1)); the index adds ln 2 to it, which lifts every reading by the same amount (about 0.17 with 30 bars) so that a path zigzagging across the whole range on every bar reads exactly 2 and a random walk reads about 1.5. A straight path gives the lowest values (about 1.26 with a 30 bar window, closer to 1 as the window grows). A window with no range at all is treated as a flat path of length 1.
How to read Fractal Dimension Index (FDI)
Values below 1.5 mean price has been moving in a fairly direct line, the mark of a trend, and the lower the value the cleaner the trend. Values above 1.5 mean the path has been doubling back on itself, the mark of a range or a noisy market. The index says nothing about direction: a steady fall and a steady rise both read low.
Traders use it as a filter: trend-following rules when the index is falling or below 1.5, range rules when it is above. A move from high readings to low ones often marks a breakout from congestion. Readings depend on the window length, and short windows give a noisy line.
Settings
- Source
- The price series whose path is measured. Close is the usual choice.
- Length
- Bars in the window. 30 is the usual value; a longer window gives a smoother, slower index.
Frequently asked questions
Does a low value mean price is going up?
No. A low value means price has moved in a fairly straight line in either direction. Use the price chart or a trend study for the direction.
Why is 1.5 the dividing line?
A random walk has a fractal dimension of 1.5, and with the ln 2 term the index reads close to 1.5 on a random walk at the usual window lengths. Below it the path is smoother than chance, which suggests a trend; above it the path is more jagged than chance, which suggests mean reversion.
Why does a perfect trend not read exactly 1?
The index approaches the true dimension only as the window grows, and its ln 2 term lifts every reading. With 30 bars a straight line reads about 1.26 and a perfectly flat window about 1.17, so judge readings against 1.5 and against their own recent history rather than against 1.