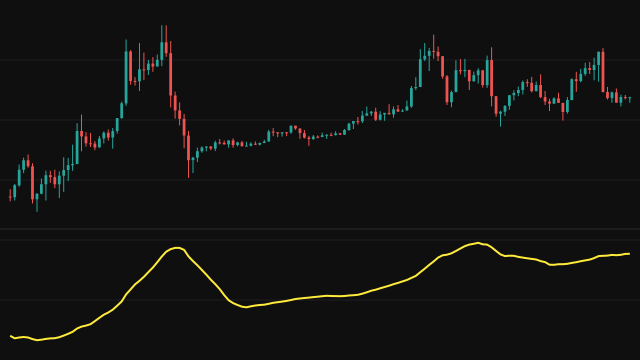
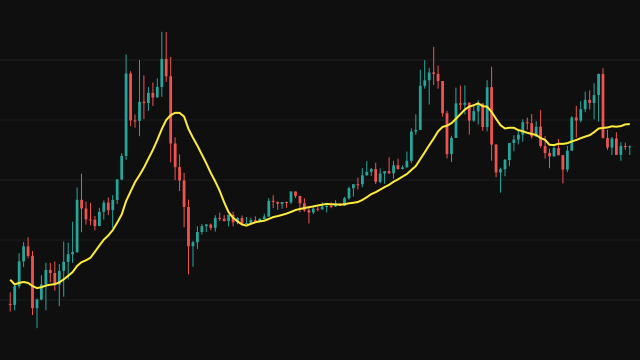
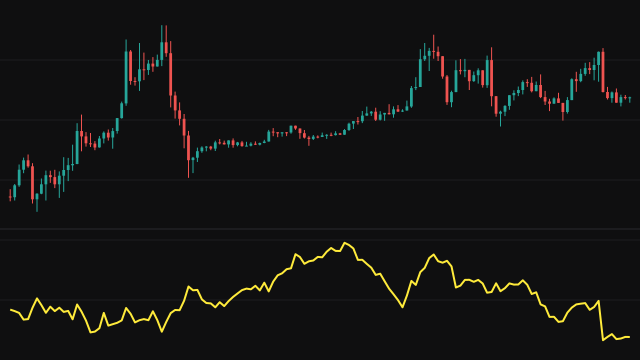
A Granger causality test asks whether knowing the past of one series helps predict another. This study runs the one-lag version. It fits two regressions over the lookback window: a restricted model that predicts Source 1 from its own previous value, and an unrestricted model that adds the previous value of Source 2. If adding Source 2 shrinks the prediction errors by a lot, the F-statistic is large.
The means, variances and covariances behind both regressions are each kept over a window of the last period bars. Each deviation is measured against the mean as it stood on the bar it entered the window, rather than the current mean. From these the study works out both sets of coefficients, then sums the squared residuals of each model over the window.
The two sums of squared residuals are carried from bar to bar and keep growing rather than being reset on each bar, so the F-statistic, (SSR1 - SSR2) / (SSR2 / (period - 3)), is taken between the two running totals and is floored at zero. Both series come from the instrument on the chart: by default the close and the volume.
How to read Granger Causality Test (GRANGER)
A higher value means the previous bar of Source 2 has added more explanatory power for Source 1 than Source 1's own previous bar alone. A value near zero means it has added little. Because the residual totals run from the start of the chart, the line reflects the whole history so far and changes slowly late in a long chart.
The test measures predictive association in the data, not real cause and effect. It is a single-lag test with a short window, so treat it as a rough gauge of whether one series leads the other rather than as a formal result.
Settings
- Source 1
- The series being predicted, the close by default.
- Source 2
- The series tested as a predictor, the volume by default. Both series come from the instrument on the chart.
- Period
- The lookback for the regressions, at least 4 bars. A longer window gives steadier coefficients.
Frequently asked questions
Does a high reading mean Source 2 causes Source 1?
No. It means the previous value of Source 2 helped predict Source 1 in this data. That is a statistical lead, not proof of cause.
Why does the line change so slowly late in the chart?
The sums of squared residuals keep adding from the first bar instead of being reset, so each new bar is a small part of a growing total.
Why is the minimum period 4?
The unrestricted model has three parameters, and the F-statistic divides by the period minus 3, so the window needs more than three observations.