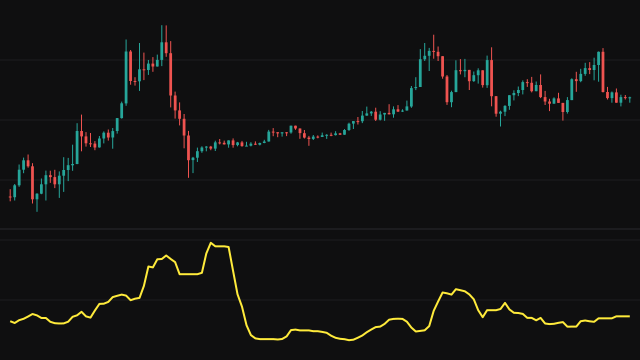
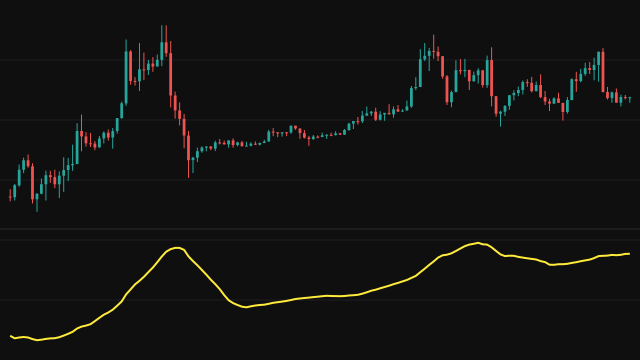
The Hurst exponent describes how a series wanders. A value of 0.5 is what a random walk gives, a value above 0.5 means moves tend to be followed by moves the same way, and a value below 0.5 means moves tend to be reversed.
The study estimates it by rescaled range analysis of the log returns, the natural log of each price over the one before. For every sub-period size n from 10 up to half the lookback, it cuts the lookback into as many sub-periods of n returns as fit, counted back from the current bar. For each sub-period it takes the running sum of the returns' deviations from their own mean, measures the range of that running sum, and divides by the standard deviation. The average of these rescaled ranges is paired with n. The exponent is the least squares slope of the log of the average rescaled range against the log of n.
A sub-period that reaches back before the first bar, that holds a missing return, or whose returns are all equal adds nothing but still counts in the average. The line therefore starts well before the lookback is full, from only the sub-periods that fit, and those early readings rest on few data points.
How to read Hurst Exponent (HURST)
Readings above 0.5 suggest the recent returns have been persistent, the behaviour a trend-following approach relies on. Readings below 0.5 suggest anti-persistence, where moves have tended to reverse. Readings near 0.5 suggest no memory either way.
The estimate is noisy, especially with a short lookback, and rescaled range analysis tends to read somewhat above 0.5 even on random data, so watch how the line changes rather than reading one value against 0.5 exactly. Long lookbacks are slow, because the work per bar grows with the square of the length.
Settings
- Source
- The price series whose log returns are analysed. It must be positive.
- Length
- The lookback, from 20 to 500 bars. Sub-periods run from 10 bars up to half of it. A longer lookback gives a steadier estimate but costs more work per bar.
Frequently asked questions
What does a value of 0.5 mean?
That the returns behave like a random walk, with no tendency to continue or reverse. Above 0.5 they tend to continue, below 0.5 they tend to reverse.
Why does the line start before the lookback is full?
Sub-periods that reach before the first bar are skipped while still counting in each average, so a reading appears as soon as two sub-period sizes find at least one complete sub-period.
Why is the minimum length 20?
The smallest sub-period is 10 returns and the largest is half the lookback, so at least two sizes need a lookback of 20 or more.