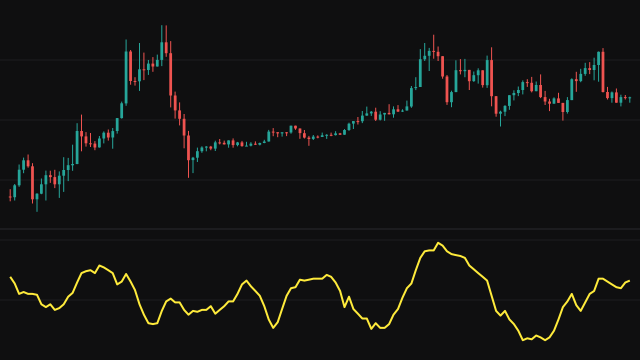
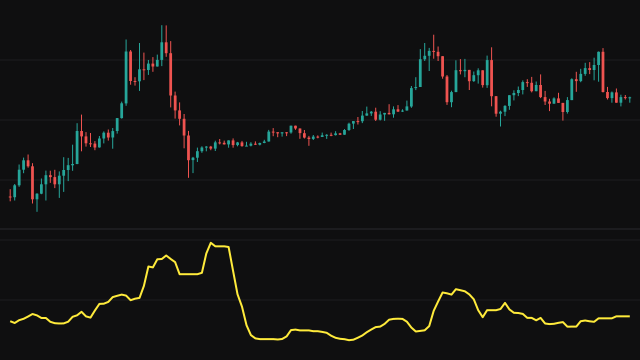
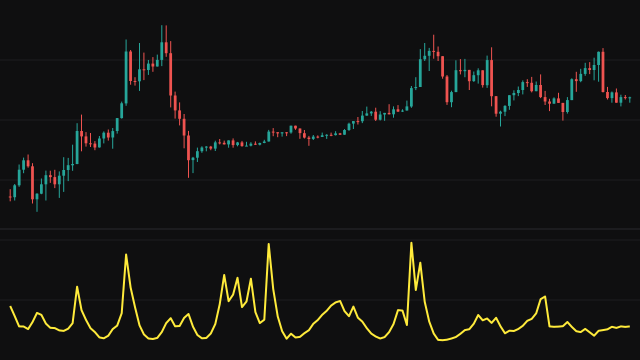
The Jarque-Bera statistic measures how far the shape of a sample departs from a normal distribution. It combines two numbers: the skewness, which says whether the values lean to one side, and the excess kurtosis, which says whether the tails are fatter or thinner than normal. Both are zero for a normal distribution.
The study takes the last length values, finds their mean, and computes the second, third and fourth central moments. The skewness is the third moment over the standard deviation cubed, and the excess kurtosis is the fourth moment over the standard deviation to the fourth power, minus 3. The statistic is the sample size over 6, times the squared skewness plus a quarter of the squared excess kurtosis.
The line starts once the window is full. A window with a missing value, or with almost no spread, gives no reading. Three reference lines mark the critical values of a chi-squared distribution with two degrees of freedom: 4.605 for the 10% level, 5.991 for 5% and 9.21 for 1%.
How to read Jarque-Bera Test (JB)
A reading below 4.605 means the test does not reject normality for the window even at the 10% level. A reading above 5.991 means the window departs from normal at the 5% level, and above 9.21 at the 1% level, usually because of a sharp move that skewed the window or fattened its tails. Spikes often mark the bars where a large move entered the window.
The test is built for independent samples, and consecutive prices are not independent, so treat the levels as a guide to unusual shape rather than a formal test. The test is applied to the source values as they are, not to their returns, so on a price source it describes the shape of the recent prices in the window.
Settings
- Source
- The series whose distribution is tested, such as the close.
- Lookback Period (Sample Size)
- How many bars form the sample, from 10 to 200. A larger sample gives a steadier statistic that reacts more slowly.
Frequently asked questions
What do the three horizontal lines mean?
They are the chi-squared critical values with two degrees of freedom at the 10%, 5% and 1% levels. A reading above a line rejects normality at that level.
Why are there gaps in the line?
A window that contains a missing value, or whose values barely vary, has no meaningful skewness or kurtosis, so the study draws nothing on that bar.
Does a high reading predict direction?
No. It says the window's shape is unusual, not which way price will move next.