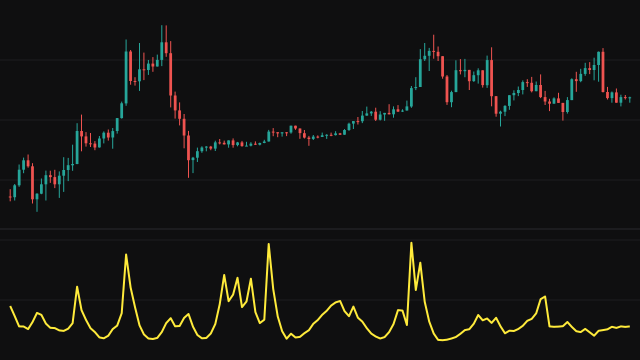
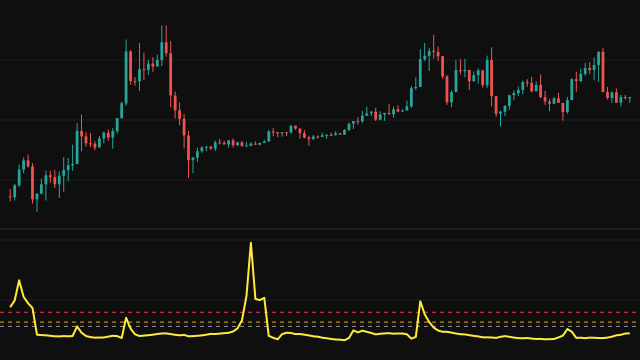
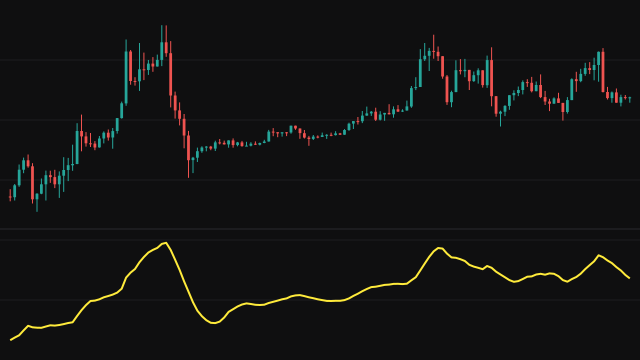
Kendall rank correlation measures whether two series tend to rise and fall together, using only the order of their values, not their size. The study takes the last period bars of both series and compares every pair of bars in that window. A pair is concordant when both series changed in the same direction between the two bars, and discordant when they changed in opposite directions. A pair where either series did not change counts as neither.
The reading, tau, is the number of concordant pairs minus the number of discordant pairs, divided by the total number of pairs, period * (period - 1) / 2. It runs from -1 to +1.
Both series come from the instrument on the chart, by default the close and the volume. A missing value in either series anywhere in the window gives no reading on that bar, and the line starts once the window is full.
How to read Kendall Rank Correlation (KENDALL)
A reading near +1 means the two series have been ranked the same way across the window: when one was higher, so was the other. A reading near -1 means they have moved in opposite directions, and a reading near 0 means there is no consistent relationship. Because only the order of the values counts, one extreme bar cannot dominate the result the way it can in an ordinary correlation.
With the default inputs the study asks whether price and volume have tended to rise together over the window. It measures association, not cause.
Settings
- Source 1
- The first series compared, the close by default.
- Source 2
- The second series compared, the volume by default. Both series come from the instrument on the chart.
- Period
- How many bars form the window, from 2 to 60. Every pair is compared, so the work grows with the square of this number.
Frequently asked questions
How is it different from an ordinary correlation?
An ordinary correlation uses the values themselves, so one large move can swing it. Kendall's tau looks only at whether each pair of bars moved the same way, so it is steadier when the window contains outliers.
Why can it not reach exactly +1 when the series look aligned?
Pairs where either series did not change count as neither concordant nor discordant but still count in the total, which pulls the reading toward zero.
Why is the period capped at 60?
Every pair of bars in the window is compared on every bar, so the work grows with the square of the period. The cap keeps the study quick.