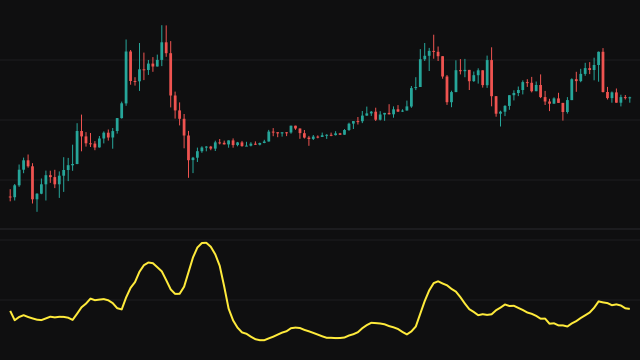
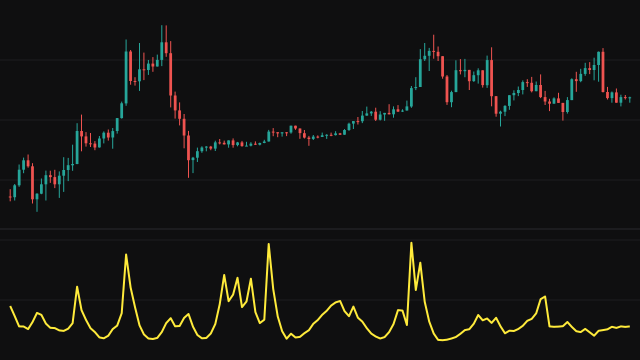
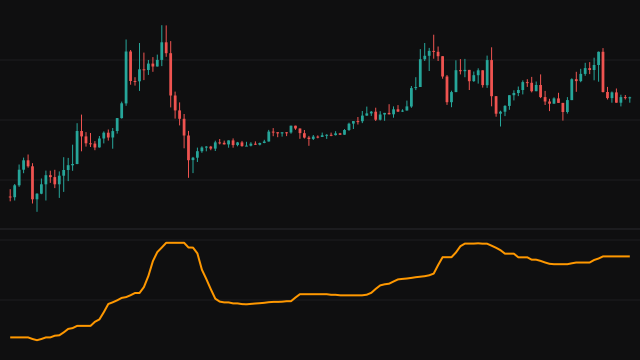
Linear Regression fits a straight line through the last period source values by least squares and plots the point where that line ends, on the current bar. The x axis is the position in the window, 0 for the oldest value up to period - 1 for the newest, and the y axis is the source.
The study keeps the window as a list of values, oldest first. On each bar it sums the values and the values weighted by their position, works out the slope and the intercept from those sums, and reads the line at the newest position. A missing source value is replaced by the last value that was present.
The window grows from two values, so the first reading is on the second bar, where the line simply runs through both points and ends at the newest value. Once the window is full it slides one bar at a time.
How to read Linear Regression (LINREG)
Read the line as a smoothed version of the source that follows the trend more closely than a simple moving average of the same length, because a straight-line fit has less lag than a flat average. When price is above the line it is running ahead of the recent trend, and when it is below it is falling behind.
The slope of the plotted line shows the direction of the fit, but a straight line cannot follow a turn, so after a reversal the line keeps extending the old trend for part of the window before it catches up. A short period hugs price closely and is noisy.
Settings
- Period
- How many bars the line is fitted through. A longer period gives a smoother line that is slower to turn.
- Source
- The series the line is fitted to, such as the close or the bar midpoint.
Frequently asked questions
Why does it lag less than a simple moving average?
A moving average reports the centre of the window, which sits half a window in the past. The regression line is read at its newest end, so it projects the window's trend up to the current bar.
Why does it overshoot after a reversal?
The fit is a straight line through the whole window. Until enough bars of the new direction are in the window, the line still leans the old way.
Why is it drawn in its own pane?
That is how this study is laid out. The values are in the same units as the source, so they can be compared with price directly.