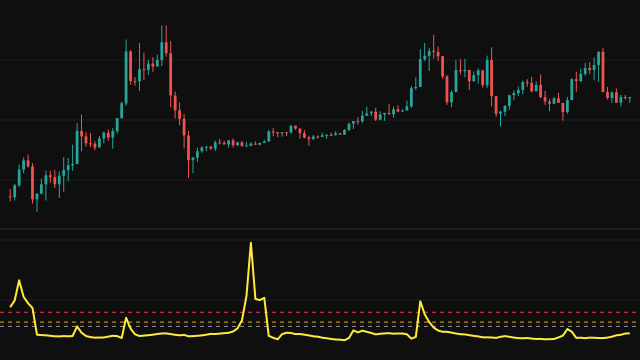
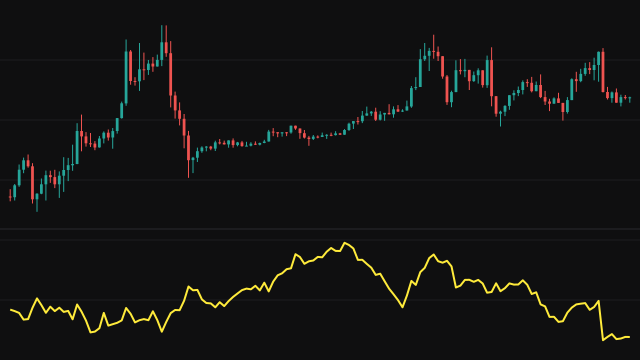
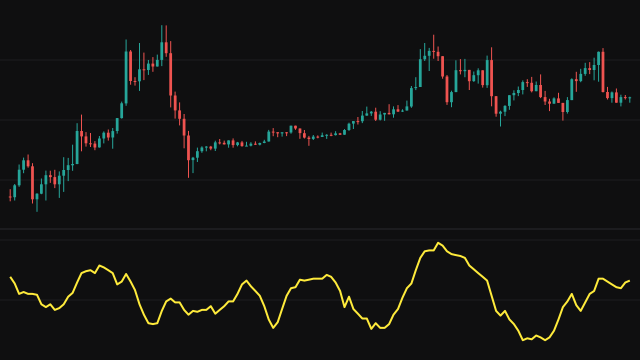
The Interquartile Range is the width of the middle half of the values in the lookback window. The study collects the source values from the last length bars, sorts them, and finds the first quartile (the 25th percentile) and the third quartile (the 75th percentile). The plotted value is the third quartile minus the first.
Each percentile is found by linear interpolation: its rank is the percentage times one less than the number of values, and when that rank falls between two sorted values the answer is taken that fraction of the way from the lower to the upper one.
Missing values are skipped, and on the first bars the window simply holds every value so far, so the line has a reading from the first bar. Because the top and bottom quarters of the window are ignored, one extreme bar moves the IQR far less than it moves a standard deviation.
How to read Interquartile Range (IQR)
A wider IQR means the bulk of recent prices is spread over a larger range, and a narrower one means the market has been trading in a tight band. Because the extremes are left out, a single spike barely changes it, so a rising IQR points to a broad widening of the range rather than one outlier.
The value is in price units, so compare it with its own history on the same instrument. It measures spread only and says nothing about direction.
Settings
- Source
- The series whose spread is measured, such as the close or the bar midpoint.
- Lookback Period
- How many bars the window covers. A longer window gives a steadier reading that reacts more slowly.
Frequently asked questions
Why use the IQR instead of a standard deviation?
The IQR looks only at the middle half of the window, so a single extreme bar has little effect. A standard deviation squares every distance, so one outlier can dominate it.
How are the quartiles found when they fall between two values?
By linear interpolation between the two neighbouring sorted values, in proportion to how far the rank falls between them.
Why does it read zero on the first bar?
The window holds a single value, so both quartiles are that value and the range between them is zero.