HT_TRENDMODE uses a Hilbert transform to measure the market's dominant cycle and then asks whether price is behaving like a cycle or like a trend.
The source (the typical price by default) is first smoothed with a four-bar weighted average and detrended with a short Hilbert filter whose bandwidth follows the current smoothed period. The same filter splits the result into an in-phase and a quadrature part, and advances each by 90 degrees. Those parts form a phasor, smoothed from bar to bar, and a homodyne discriminator turns the phase change between bars into a cycle period, held between 6 and 50 bars and smoothed again into the smoothed period.
Separately, the study tracks the phase of the cycle and how fast it is turning. A phase change smaller than 0.1 is ignored, and the last real change is kept instead. Two pi divided by that change, smoothed, is the instantaneous period. When the instantaneous period is more than 1.5 times the smoothed period, the phase is barely turning, which is how a trend looks, and the study reads 1. Otherwise it reads 0. All earlier values before the first bar count as zero, and the cycle state starts at a 15 bar period.
How to read HT_TRENDMODE: Hilbert Transform Trend Mode
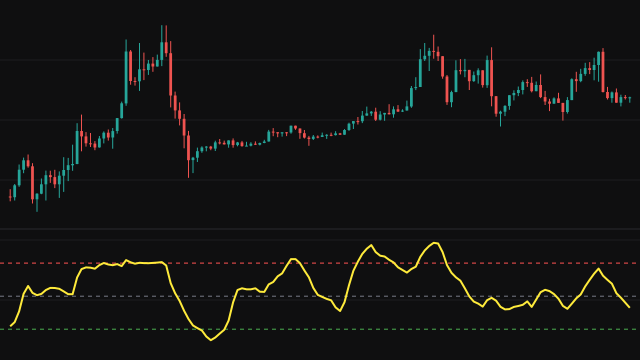
Read the step line as a regime switch. A green 1 says the cycle measurement has stalled and price is trending, which suits trend-following tools. A red 0 says price is moving in measurable cycles, which suits oscillators and range methods.
The line is binary and can flip often when the market sits between the two regimes, so it works best as a filter for other tools rather than as a trade signal by itself. The first few dozen bars are spent filling the filters and settling the period estimate, so ignore the readings there.
Settings
- Source
- The price series the cycle is measured on. The default is the typical price, the average of high, low and close.
Frequently asked questions
What do 1 and 0 mean?
1 means the measured cycle has slowed so much that price is treated as trending. 0 means price is cycling at a measurable period.
Why does the line flip back and forth sometimes?
When the instantaneous period sits close to 1.5 times the smoothed period, small changes push it over and back. Those stretches are a market between regimes, not a clean trend or a clean cycle.
Why should I ignore the first bars?
The filters reach six bars back several times over and the period estimate starts from a fixed 15 bars, so it takes a while for the measurement to reflect the real data.