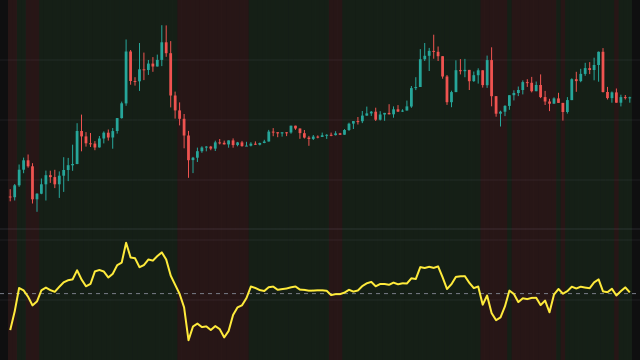
Polarized Fractal Efficiency compares two distances. The straight line is the hypotenuse of the change in the close over the period and the period itself counted in bars. The fractal path is the sum of the same kind of step for every bar in between: the square root of each bar-to-bar change squared plus one. Dividing the straight line by the path and multiplying by 100 gives the efficiency, which is then made negative when the close is lower than it was period bars ago.
A move that goes straight in one direction has a path almost as short as the straight line, so it reads close to +100 or -100. A choppy move walks a long path to get nowhere and reads near zero.
The raw value is smoothed by an exponential average of the smooth period. The average is seeded with the first raw value and scaled by a correction that fades away over the first bars. The line starts once period bars of history exist.
How to read PFE: Polarized Fractal Efficiency
Above zero, price has been moving up efficiently; below zero, down. Readings beyond the dashed +50 and -50 lines show a strong, direct move, and readings near zero show a market that is busy but going nowhere. A turn back toward zero from an extreme is an early sign that the move is losing its directness.
The step length adds one bar of time to each price change, so the scale depends on how large price changes are compared with one. On an instrument that moves many points per bar the time term matters little and the reading behaves mostly like a ratio of net to total price movement.
Settings
- Period
- How many bars the straight line and the path span. A longer period measures efficiency over a longer swing.
- Smooth Period
- The length of the exponential average applied to the raw efficiency. A longer value gives a smoother, slower line.
Frequently asked questions
What do the dashed lines at 50 and -50 mean?
They mark efficient moves. Beyond them, price has taken a fairly direct route over the period, up above +50 and down below -50.
Why is the sign sometimes negative?
The efficiency itself is always positive. It is made negative when the close is below the close period bars ago, so the sign carries the direction.
When does the line start?
On the first bar that has a close period bars back, because the straight line needs both ends.