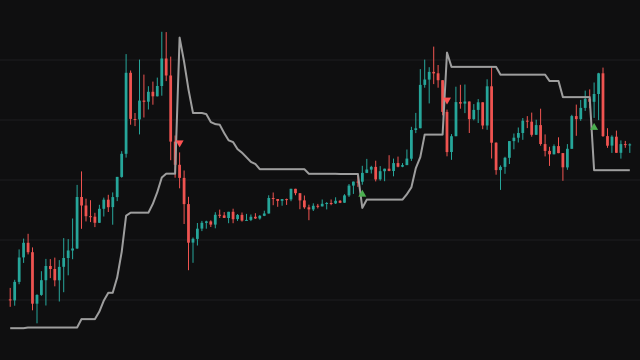
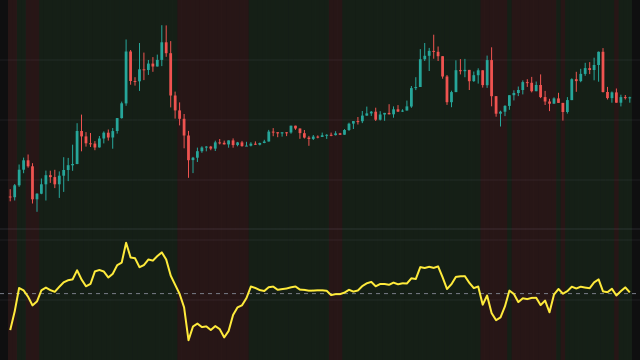
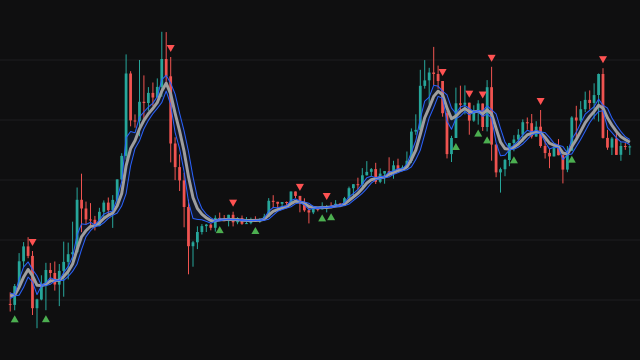
The Range Action Verification Index measures how far apart a short and a long simple moving average of the close have drifted. It takes the absolute difference between the two averages and expresses it as a percentage of the long average, so the reading is always zero or above and compares across instruments of very different price.
When price trends, the fast average pulls away from the slow one and the reading rises. When price moves sideways, the two averages sit close together and the reading falls toward zero. A fixed threshold line, 3% by default, is drawn as the dividing line between the two states.
The short period must be shorter than the long period; if it is not, the study draws nothing. The line starts once the long average has a full window of closes.
How to read RAVI: Chande Range Action Verification Index
Read the line against the dashed threshold. Above it, the averages have separated enough to class the market as trending. Below it, they sit close together and the market is classed as ranging.
The index has no direction: a strong fall and a strong rise both push it up. Pair it with the slope of an average or with price itself to know which way the trend runs. The right threshold depends on the instrument and the timeframe: shorter bars usually leave a smaller percentage gap between the two averages, so a level below the default may separate the two states better on them.
Settings
- Short Period
- The length of the fast simple average. A shorter value reacts sooner and makes the reading noisier.
- Long Period
- The length of the slow simple average. It also sets how many bars pass before the line first appears.
- Threshold
- Where the dashed dividing line between trending and ranging is drawn, in percent. It does not change the calculation.
Frequently asked questions
Why is the line always positive?
It uses the absolute gap between the two averages, so it measures how strong the separation is and not which side the fast average is on.
Why does nothing appear when I change the periods?
The short period must be smaller than the long period. When it is not, the study treats the settings as invalid and draws no line.
How is it different from a moving average crossover?
A crossover tells you which average is on top. This index tells you how far apart they are as a share of the slow average, which is a measure of whether the market is trending at all.