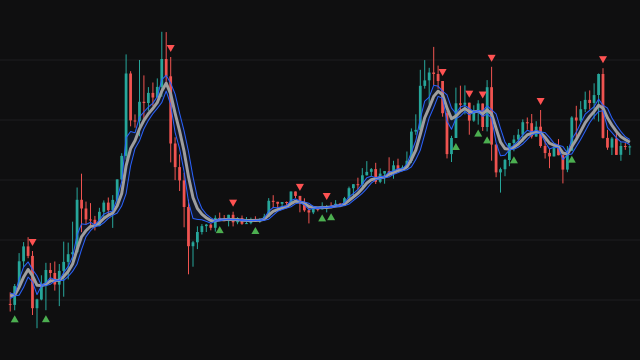
Supertrend draws one line that follows price at a distance set by volatility. Two bands are built around each bar's midpoint, (high + low) / 2: the upper band Factor average true ranges above it and the lower band the same distance below. The average true range is Wilder's average of the true range over ATR Length bars.
The bands only move in one direction while price respects them: the lower band can rise but not fall while the close stays above it, and the upper band can fall but not rise while the close stays below it. In an uptrend the line is the lower band, drawn in green under price; when a close drops below it the trend turns down and the line jumps to the upper band, drawn in red above price. The area between the line and the middle of each candle body is shaded in the trend's colour.
How to read Supertrend
Green means the trend is up and the line is a trailing support; red means it is down and the line is a trailing resistance. A change of colour is the signal: the close has crossed the line. Many traders use the line itself as a stop, moving it up with the green line in a long position and down with the red line in a short one.
A larger Factor keeps the line further from price, so it flips less often and gives back more before it does; a smaller one reacts sooner but flips more in a sideways market, where any trailing line is whipsawed.
Settings
- ATR Length
- Bars in Wilder's average of the true range that sets the distance of the bands.
- Factor
- How many average true ranges the bands sit from the bar's midpoint. Larger values flip less often.
Frequently asked questions
What makes the line change colour?
A close beyond the line. In an uptrend a close below the green line turns the trend down and the line moves to the upper band; in a downtrend a close above the red line turns it up.
Why does the line sometimes go flat?
A band only moves toward price. While the newly computed band would loosen the stop, the line keeps its previous value, which draws as a flat segment.
Which alerts does it offer?
Three: Downtrend to Uptrend, Uptrend to Downtrend, and Trend Change for either direction. Each fires on the bar the direction flips.