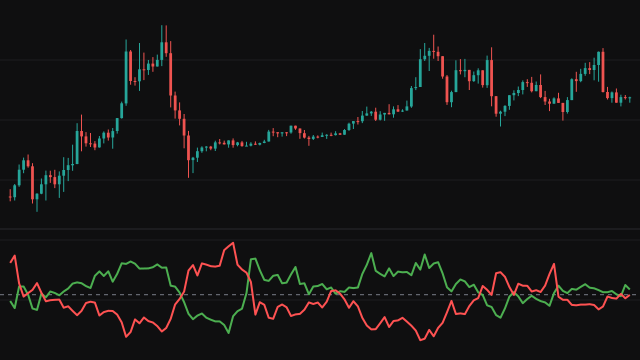
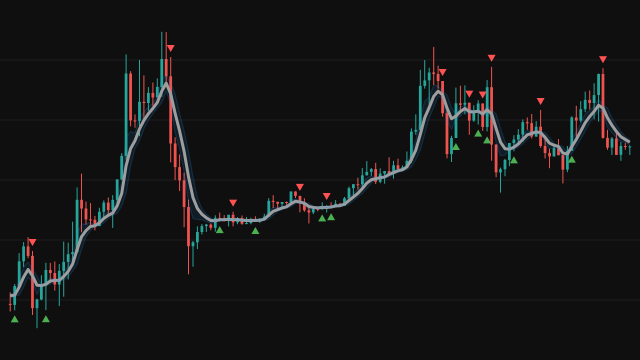
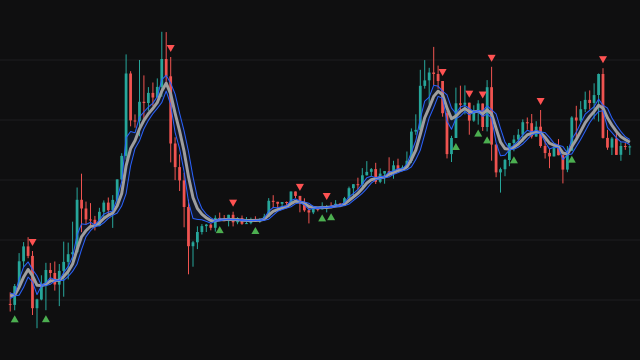
The Vertical Horizontal Filter compares how far price got with how far it walked to get there. The vertical part is the highest close minus the lowest close over the last period plus one bars. The horizontal part is the sum of the absolute bar-to-bar changes in the close over the last period bars. The reading is the first divided by the second.
When price moves steadily in one direction, almost every step adds to the range, so the ratio is high. When price swings back and forth, the steps add up to a long path while the range stays narrow, so the ratio is low. If the closes have not moved at all over the window, nothing is drawn for that bar.
The line starts once a full period of changes is available. Two dashed levels mark the trend and range thresholds.
How to read VHF: Vertical Horizontal Filter
Above the trend threshold, 0.4 by default, the closes have covered most of the path they walked, and the market is read as trending. Below the range threshold, 0.25 by default, most of the path was spent going back and forth, and the market is read as ranging. Between the two, the reading gives no clear verdict.
A rising line says the move is becoming more directional; a falling one says it is losing its shape. The filter has no direction, so it says nothing about whether the trend is up or down. Pair it with price or an average for that. The thresholds are fixed lines, and the level that separates the two states best differs between instruments and timeframes.
Settings
- Period
- How many bar-to-bar changes the path sums over. A longer period gives a steadier reading that turns later.
- Trend Threshold
- Where the upper dashed line is drawn. It marks the level above which the market is read as trending and does not change the calculation.
- Range Threshold
- Where the lower dashed line is drawn. It marks the level below which the market is read as ranging and does not change the calculation.
Frequently asked questions
Why can the value never exceed 1?
The range of the closes can never be longer than the sum of the steps between them, so the ratio is at most 1, reached only when every step goes the same way.
Can the line have gaps?
Only where the closes did not move at all across the window. There is then nothing to divide by, so the study leaves that bar empty rather than inventing a value.
Does a high reading mean prices are rising?
No. A steady fall reads just as high as a steady rise. The filter measures how directional the move is, not its direction.