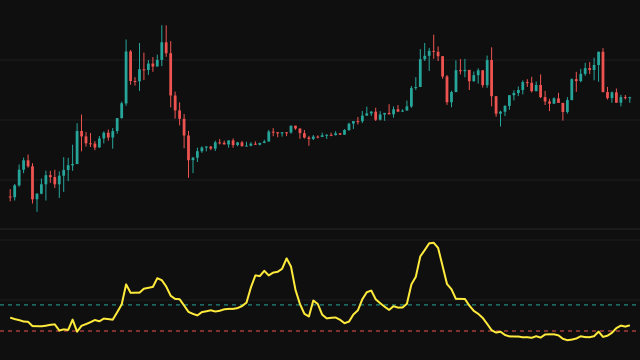
The Vortex Indicator measures upward and downward movement between neighbouring bars. Upward movement on a bar is the distance from the previous bar's low to this bar's high; downward movement is the distance from the previous bar's high to this bar's low. Each is summed over the period and divided by the sum of true range over the same bars, giving VI+ and VI-.
The sums start on the first bar and grow until they hold a full period of bars, after which the oldest bar drops out as each new one arrives, so both lines are drawn from the start of the chart. On the first bar, which has no previous bar, both movements take that bar's own range. If the summed true range is zero, both lines read zero.
A dashed reference line is drawn at 1.
How to read Vortex Indicator
When VI+ is above VI-, upward movement has been covering more ground than downward movement over the window, and the trend leans up. When VI- is above VI+, the reverse holds. A crossing of the two lines marks the point where control changes hands, and the wider the gap between them, the more one-sided the move.
In a sideways market the lines tangle around each other and cross often, so many crossings are noise. A longer period gives fewer, later crossings. The first period bars are built from a shorter window and are less reliable.
Settings
- Period
- How many bars the movements and the true range are summed over. A longer period gives smoother lines and fewer crossings.
Frequently asked questions
Why do the lines start on the first bar?
The sums begin with the first bar and grow until they cover a full period. The early values are built from fewer bars, which is why they swing more.
What does the line at 1 mean?
It is a reference. Readings above 1 mean that side's movement exceeded the true range summed over the window, which happens in strong one-way moves.
Can both lines rise together?
Yes. In a period of wide, overlapping bars both movements grow relative to true range, so both lines can lift while neither side has clear control.