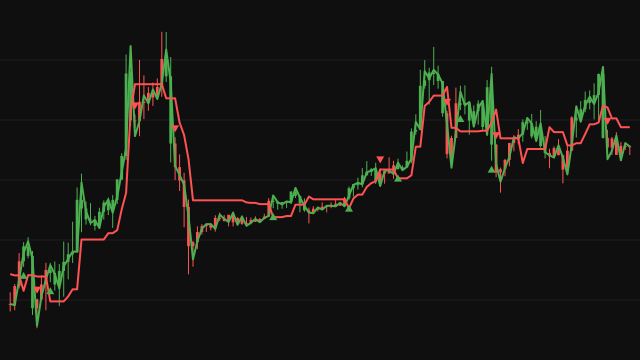
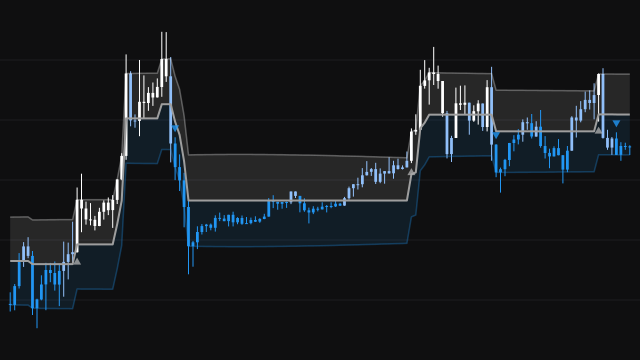
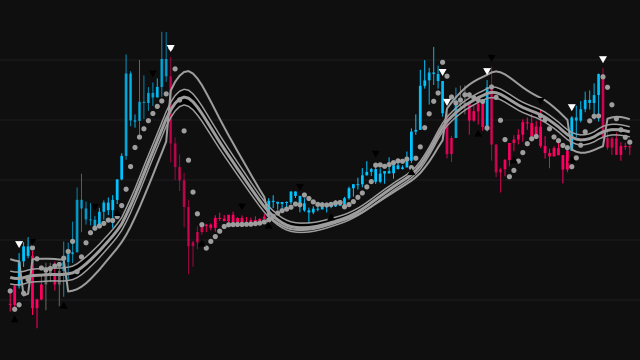
AlphaTrend trails price with a line that only moves toward it. The distance is a simple average of the true range over the Common Period, scaled by the Multiplier. While the money flow index over the same period is at or above 50, buyers are taken to be in control and the line trails that distance below each bar's low; below 50 it trails the same distance above each bar's high. Either way it never moves away from price, so it goes flat in a range and climbs or falls in a trend.
The line is drawn in blue together with its own value two bars back in red, and the space between them is shaded green while the line is above that earlier value and dark red while it is below. With Change calculation (no volume data)? turned on, the relative strength index of the source replaces money flow, for an instrument with no volume.
How to read AlphaTrend
A BUY label marks the bar where the line crosses above its value two bars back for the first time since the last crossing below, and a SELL label the reverse, so each label is a change of direction rather than every crossing. Green shading is a rising trend line and red a falling one; a long flat stretch is a market moving sideways.
The labels sit at the lagged line, close to price. A larger Multiplier keeps the line further away and gives fewer, later signals; a shorter Common Period reacts sooner and signals more often.
Settings
- Multiplier
- How many average true ranges the line trails from the low or the high. Larger values give fewer, later signals.
- Common Period
- Bars in the average of the true range and in the money flow index (or relative strength index).
- Source
- The price series for the relative strength index, used when the no volume data option is on.
- Show Signals?
- Draw the BUY and SELL labels where the line changes direction.
- Change calculation (no volume data)?
- Use the relative strength index of the source instead of money flow, for an instrument that reports no volume.
Frequently asked questions
Why are there two lines?
The red line is the blue AlphaTrend line two bars earlier. Their crossings are the signals, and the shading between them shows which way the line is moving.
Why can the line read zero on the first bars?
Before money flow has a value the line has nothing to trail and holds its starting value of zero, then catches up to price once the averages exist. On a chart opened on recent bars this is off screen.
Which alerts does it offer?
Potential and confirmed BUY and SELL, price crossing the line, and a candle crossing over or under the line, each also in an after-close form one bar later.