SSL Hybrid combines several trend lines built from one menu of averages. The Baseline is an average of the close over the Baseline Length, of the type picked in Baseline Type: SMA, EMA, DEMA, TEMA, LSMA (the linear regression value), WMA, MF (a modular filter), VAMA (the EMA plus the middle of the source's highest and lowest distance from it), TMA, HMA, JMA, Kijun v2 (midpoints of the high and low range), EDSMA (an average whose speed follows a super smoother of the two-bar change) or McGinley. Every exponential average starts from its first value. A channel sits around the baseline at Channel Multiplier times an exponential average of the true range, or of the bar's high minus its low.
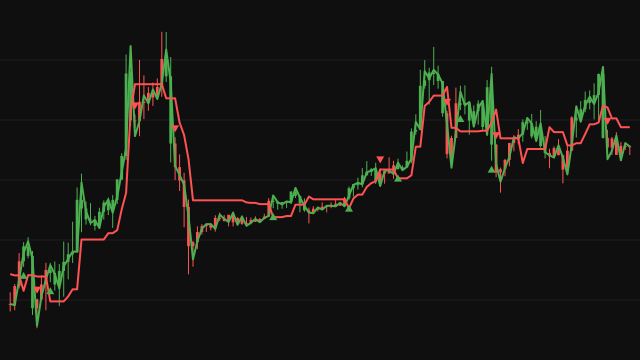
Each SSL line is one average of the highs and one of the lows. When the close goes above the average of the highs the side turns up and the line follows the average of the lows; when it goes below the average of the lows the side turns down and the line follows the average of the highs; between them the side holds. SSL1 uses the baseline's type and length, SSL2 its own type and length, and a third, the exit line, sets the arrows and is not drawn.
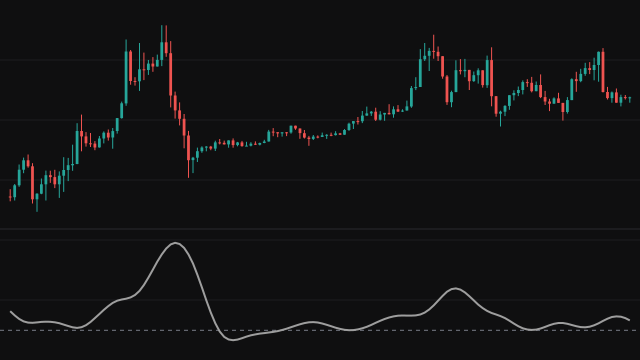
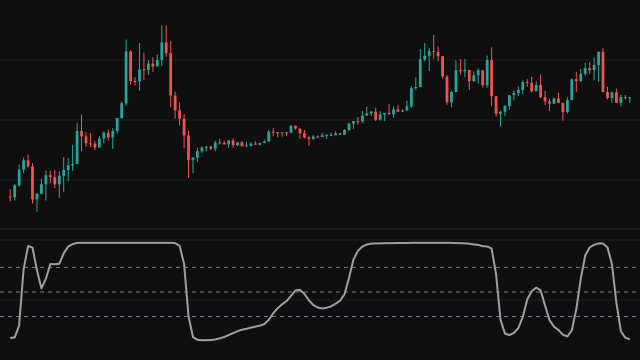
The average true range is the true range smoothed by ATR Smoothing. It gives the optional +ATR and -ATR bands around the close, and its percentile over the Risk Lookback Period (the share of earlier values at or below the latest) sets the transparency of the bullish and bearish colours, so lines and candles fade as volatility rises.
How to read SSL Hybrid
Candles and the baseline are coloured bullish while the close is above the channel, bearish while it is below, and grey inside it, which marks a market without direction. SSL1 is coloured by the close's side of it. SSL2 is coloured bullish on a continuation: the close above both the baseline and SSL2, with SSL2 within Continuation ATR Criteria average true ranges of the close (and bearish for the mirror case).
An up arrow below a bar marks the close crossing above the exit line and a down arrow above a bar the close crossing below it, read as the point to leave a short or a long. A diamond above a bar marks a candle body larger than one average true range while the baseline is within one average true range of the close, a possible false breakout. The table in the bottom right shows the latest bar's risk level, how far the close is from the baseline, the volatility percentile and the average true range. Lines and arrows react only after the averages move, so they confirm a trend rather than predict one.
Settings
- Display Mode
- Which lines are drawn: the baseline, the SSL lines, the exit arrows, or all of them.
- Color Bars
- Colour the candles bullish, bearish or grey by the close's side of the baseline channel.
- Show Signal Diamonds
- Mark candles whose body is larger than one average true range while the baseline is within one average true range.
- Show Risk Table
- Show the table of risk level, entry distance, volatility percentile and average true range.
- Bullish Color
- The colour of the bullish side, faded as the volatility percentile rises.
- Bearish Color
- The colour of the bearish side, faded as the volatility percentile rises.
- Baseline Type
- The average used for the baseline, its channel and SSL1.
- Baseline Length
- Bars in the baseline average, in SSL1 and in the channel's range average.
- Source
- The price series the channel is centred on. The baseline itself averages the close.
- Show Baseline Channel
- Draw the channel lines and the shading around the baseline.
- Channel Multiplier
- The channel's half width as a multiple of the average range. Larger values widen the grey zone.
- Use True Range for Channel
- Measure the channel with the true range, which includes gaps from the previous close, rather than the bar's high minus its low.
- SSL2 Type
- The average used for the SSL2 line.
- SSL2 Length
- Bars in the SSL2 averages. Short values make SSL2 follow price closely.
- Continuation ATR Criteria
- How many average true ranges SSL2 may sit from the close for a continuation to count.
- Exit Type
- The average used for the exit line whose crossings draw the arrows.
- Exit Length
- Bars in the exit line's averages. Shorter values give earlier and more frequent arrows.
- ATR Period
- Bars in the average true range.
- ATR Multiplier
- The distance of the ATR bands from the close, in average true ranges.
- ATR Smoothing
- The average applied to the true range: RMA, SMA, EMA or WMA.
- Show ATR Bands
- Draw the +ATR and -ATR bands around the close.
- Risk Lookback Period
- Earlier bars the volatility percentile compares the latest average true range with.
- Risk Sensitivity
- The power the percentile is raised to before it sets the transparency. Higher values fade the colours only at the highest volatility.
- Enable Risk Gradient
- Fade the bullish and bearish colours as volatility rises. Off, they are always solid.
- Phase
- JMA phase from -100 to 100; higher values let the JMA lead more and overshoot more.
- Power
- JMA power, the exponent of its smoothing factor. Higher values make it react faster.
- Kijun MOD Divider
- Kijun v2 divides its length by this for its shorter range midpoint.
- Volatility Lookback Length
- Bars over which VAMA takes the highest and lowest distance of the source from its average.
- Beta
- How far the MF filter leans toward the envelope on the side of the last breakout, from 0 to 1.
- Feedback
- Blend the MF filter's previous value into its input, which smooths it further.
- Feedback Weighting
- With feedback on, the weight of the source in the MF filter's input; the rest is its previous value.
- Super Smoother Filter Length
- The length of the super smoother inside EDSMA.
- Super Smoother Filter Poles
- Two or three poles for the super smoother inside EDSMA. Three poles smooth more and lag more.
Frequently asked questions
Why do some candles keep their own colour on the first bars?
The bullish and bearish colours take their transparency from the volatility percentile, which needs the average true range plus Risk Lookback Period earlier values. Until then those colours do not exist, so a candle above or below the channel keeps its own colour (one inside it is still grey). Turn off Enable Risk Gradient to colour them from the start.
Why does the SSL2 line start far from price?
The default SSL2 type is JMA, whose smoothing stages start from zero, so it climbs to price over the first few bars. Other types instead start once their window is full.
What does the exit line do if it is not drawn?
It is a third SSL line, of Exit Type and Exit Length. The arrows mark the close crossing it, and the exit alerts fire on the same crossings.
Which alerts does it offer?
Exit long and exit short, SSL2 buy and sell continuation, price above the upper channel or below the lower channel, price crossing the baseline, a high risk entry, a false breakout warning and extreme volatility.