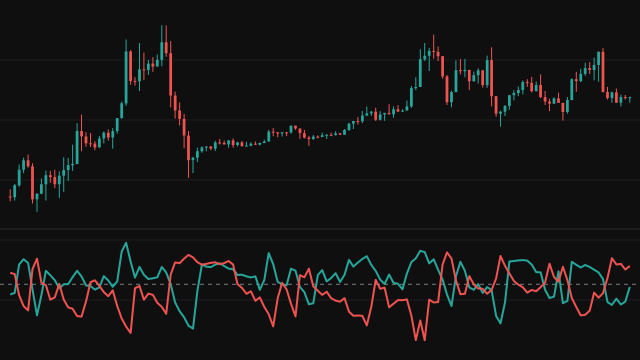
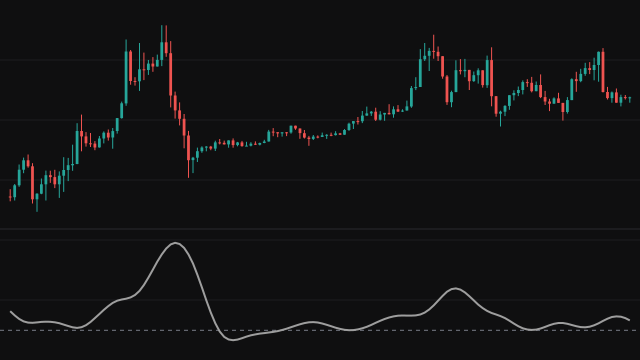
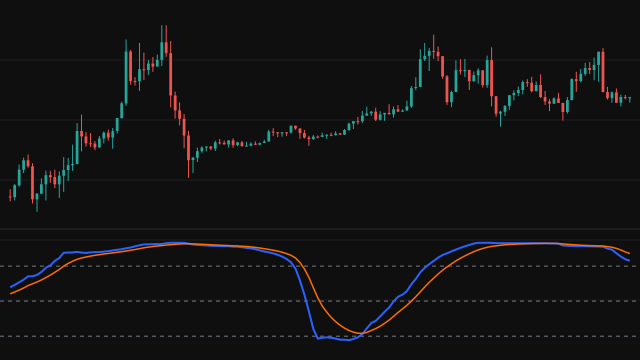
The Continuation Index, by John Ehlers, is built on the observation that while price trends it stays on one side of a smooth filter. It compares two filters of the source. The fast one is an UltimateSmoother over half of Length. The slow one is a Laguerre filter: its first stage is an UltimateSmoother over the full Length, each further stage is built from the previous bar's values of the stage below it and of itself with the damping Gamma, and the filter is the plain average of the first Order stages. Every stage starts at the first value, so there is no start-up swing.
The gap between the fast smoother and the Laguerre filter is divided by its mean absolute size over Length bars and doubled. An inverse Fisher transform then squeezes the result into the range -1 to 1, so ordinary readings are pushed out toward the ends and the line spends most of its time near +1 or -1. When the scale is zero the previous reading is kept.
How to read Ehlers Continuation Index
Near +1 the fast smoother is well above the slow filter, an uptrend that is continuing; near -1 a downtrend that is continuing. The useful moments are the transitions: a swing from -1 up through zero marks the onset of an uptrend, and a drop from +1 toward zero warns that the uptrend is losing steam before price has clearly turned. The dashed lines at 0.5 and -0.5 help separate a committed reading from a transition.
Because the transform pushes readings to the ends, the line looks almost like a two-state switch, and it cannot show how strong a trend is once it is pinned at +1 or -1. In a sideways market the two filters cross often and the index flips between the extremes.
Settings
- Source
- The price series both filters are taken over. Close is the default.
- Gamma
- Damping of the Laguerre stages, from 0 to 0.99. Higher makes the slow filter smoother and later, so the index holds its side longer.
- Order
- Number of Laguerre stages averaged, from 1 to 10. More stages make the slow filter lag more.
- Length
- Length of the slow filter's first stage and of the scaling window. The fast smoother uses half of it.
Frequently asked questions
Why does the line sit at +1 or -1 most of the time?
The inverse Fisher transform compresses large readings toward the ends. A gap of about twice its usual size already reads above 0.99, so only the transitions between trends show values in the middle.
What scale is the gap divided by?
The average of its absolute value over the last Length bars. Doubling the gap over that average and passing it through the transform gives the final reading.
When does the first value appear?
Once the scaling window is full: on the bar Length minus one, bar 39 with the defaults.