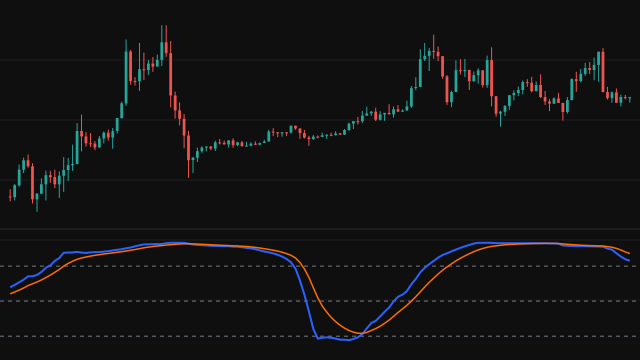
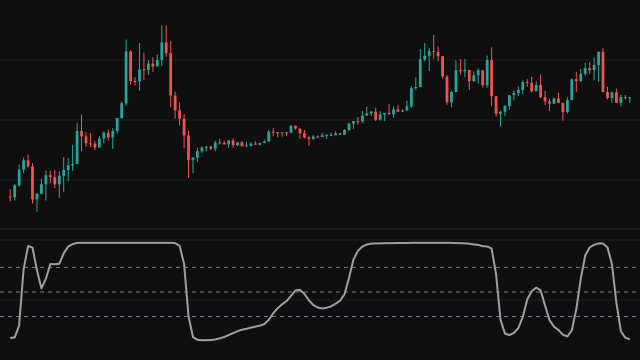
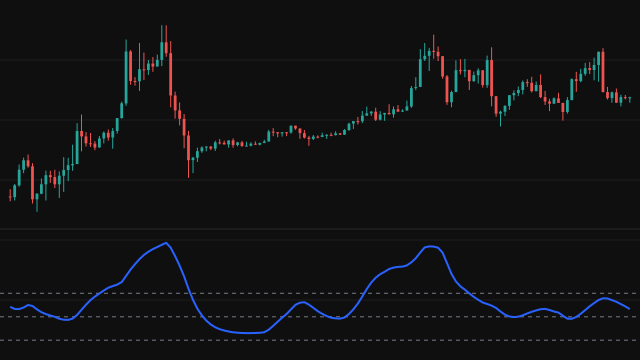
The Random Walk Index, introduced by Michael Poulos, asks whether price has travelled further than chance alone would carry it. A random walk drifts away from its start roughly in proportion to the square root of the number of steps, so the study divides each move by the average true range times the square root of the number of bars it took.
For every lookback n from Shortest Lookback to Longest Lookback (2 to 14 by default), the RWI High takes this bar's high minus the low n bars back, and the RWI Low takes the high n bars back minus this bar's low. Each move is divided by the simple average true range over the n + 1 bars it spans times the square root of n, and each line keeps the largest ratio across all lookbacks. Both lines start once the longest lookback is complete, on bar Longest Lookback.
How to read Random Walk Index (RWI)
A reading above 1 means price moved further than a random walk of that length would usually go. RWI High above 1 and above RWI Low points to an uptrend; RWI Low above 1 and above RWI High points to a downtrend. When both lines sit below 1 the market is moving no more than chance would explain, which is a range rather than a trend.
Because each line takes the best lookback, it reacts quickly to a sharp move and can spike on a single large bar. Read it together with price and treat a single bar above 1 with caution. Short lookbacks such as 2 to 7 suit short swings; a range such as 8 to 64 looks for longer trends.
Settings
- Shortest Lookback
- The shortest lookback tested. Raise it to ignore the quick one or two bar moves that short lookbacks pick up. 2 is the usual value.
- Longest Lookback
- The longest lookback tested. A larger value looks for longer trends and needs more bars before the lines start. 14 is a common value.
Frequently asked questions
Why divide by the square root of the number of bars?
A random walk drifts away from its start in proportion to the square root of the number of steps, so this scaling turns each move into a comparison with what chance would produce over the same span.
What does the level at 1 mean?
It marks a move equal to what a random walk would cover. Above it, the move is larger than chance would explain; below it, the move is within the range of noise.
Why are there two lines?
One measures upward moves from past lows to the current high and the other downward moves from past highs to the current low, so the stronger one shows the direction of the trend.
What if the shortest lookback is larger than the longest?
No lookback is tested and both lines stay empty. Keep the shortest at or below the longest.