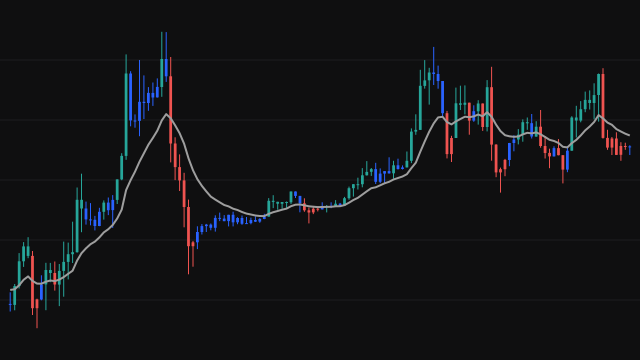
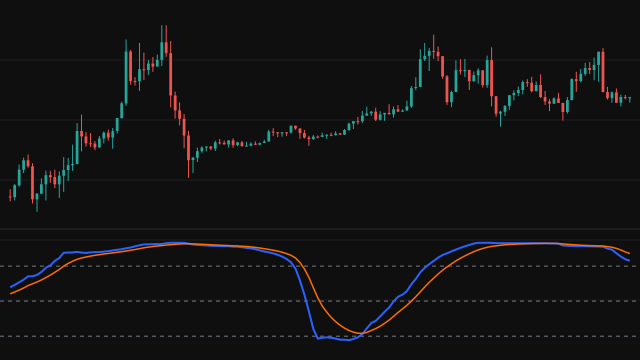
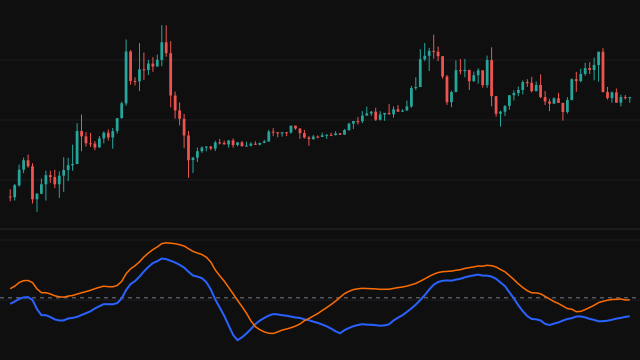
The Directional Trend Index, described by William Blau, measures whether the bars are pushing their highs up or their lows down, and how consistently. On each bar the up move is the rise in the high from the previous bar (zero if the high fell) and the down move is the fall in the low (zero if the low rose). Their difference is the net move for the bar.
The net move and its absolute size are each smoothed by three exponential averages in a row, by default over 14, 10 and 5 bars. The index is 100 times the smoothed net move divided by the smoothed size, so it runs from -100 to 100: near the ends when nearly every bar moved the same way, near zero when up and down moves cancel.
How to read Directional Trend Index (DTI)
Above zero, highs have been rising more than lows have been falling, an uptrend; below zero, a downtrend. Readings beyond +25 or -25 are commonly taken as a trend with real strength, and a turn back toward zero from an extreme as a trend losing force. A cross of the zero line marks a change in which side has the upper hand.
The triple smoothing makes the line steady but slow: it lags turning points by several bars, and in a range it drifts around zero without giving a clear signal.
Settings
- First Smoothing
- Bars in the first exponential average, applied to the raw moves. A larger value gives a smoother, slower line. 14 is the usual value.
- Second Smoothing
- Bars in the second exponential average, applied to the result of the first. 10 is the usual value.
- Third Smoothing
- Bars in the third exponential average, applied to the result of the second. 5 is the usual value.
Frequently asked questions
How is it different from a momentum oscillator on the close?
It looks at the highs and the lows rather than the close, so it measures whether the range of each bar is shifting up or down, which is the idea behind directional movement.
Why smooth three times?
The bar to bar moves in the highs and lows are noisy. Three short averages in a row remove most of that noise while keeping the lag smaller than one very long average would.
Can it reach 100?
Only if every bar the averages remember had a net upward move, the rise in its high outweighing any fall in its low. In practice even strong trends stay well inside the range.