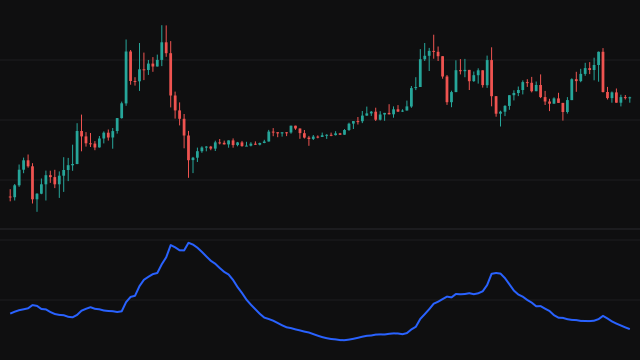
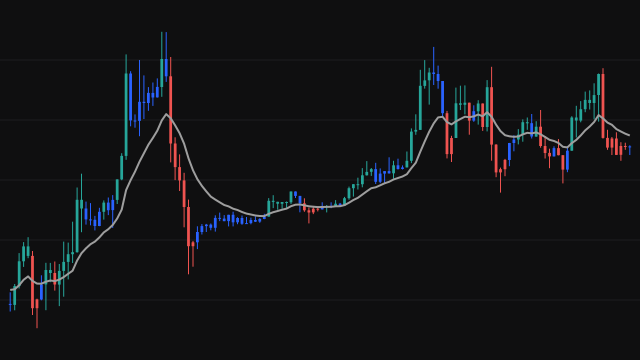
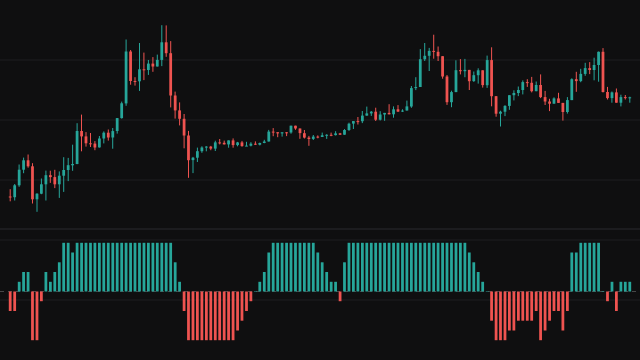
The Trend Detection Index, described by M. H. Pee, separates trending stretches from sideways ones. Momentum is the change of the source over Length bars (20 by default). The Direction line is the sum of that momentum over the last Length bars, so it is positive when the source has been rising and negative when it has been falling.
The TDI line is the size of that net momentum minus a measure of noise: the sum of absolute momentum over the last 2 * Length bars less the sum over the last Length bars, which leaves the absolute momentum of the Length bars before the recent stretch. When the recent push in one direction is larger than the earlier back and forth, the index is positive; when it is not, the index is negative.
How to read Trend Detection Index (TDI)
A TDI above zero says a trend is present, and the Direction line says which way: above zero a rising trend, below zero a falling one. A TDI below zero says the market lacks a trend worth following, which is where trend systems tend to give back profits. A common use is to take trend trades only while the TDI is positive and in the direction of the Direction line, and to stand aside or use range tactics while it is negative.
Both lines are built from momentum over Length bars, so they lag turns in price, and the index needs three times Length bars before it first appears.
Settings
- Source
- The price series momentum is measured on. Close is the default.
- Length
- Bars in the momentum change and in each window sum. Longer looks for slower trends and needs more history before it appears.
Frequently asked questions
Why are there two lines?
The TDI line answers whether a trend is present and the Direction line answers which way it points. Neither is meant to be read alone.
Why does the TDI start so late?
Momentum needs Length bars and the noise measure sums it over 2 * Length more, so the first value appears once 3 * Length bars are on the chart, the 60th bar at the default of 20.
Can the TDI be positive while price goes nowhere?
Only briefly. It is positive when the net momentum of the recent bars outweighs the earlier noise; once price settles into a range the net momentum shrinks and the index drops below zero.