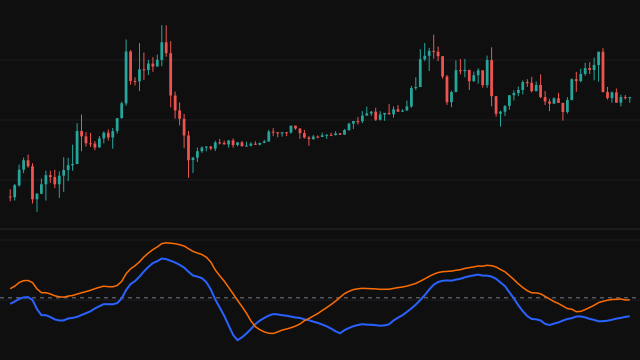
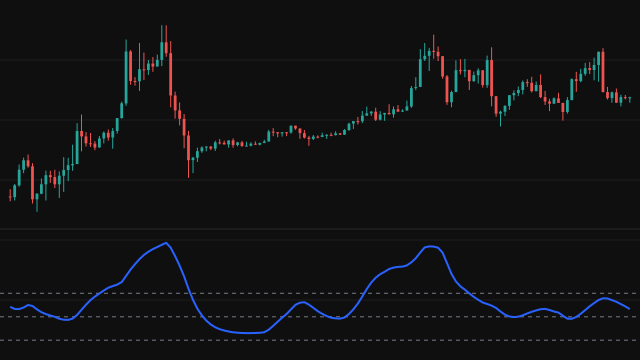
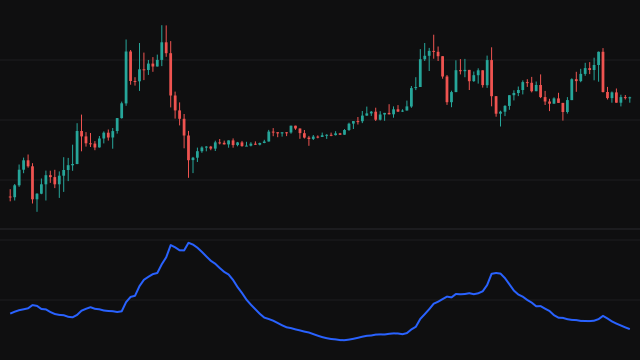
The Elder Impulse System, described by Alexander Elder, joins a trend reading and a momentum reading into one colour per candle. The trend is an exponential average of the close over EMA Length bars, drawn on the chart. The momentum is the MACD histogram: the gap between a fast and a slow exponential average of the close, minus an exponential average of that gap over MACD Signal Length bars.
On each bar both readings are compared with the previous bar. When the average and the histogram both rose, the candle is painted green; when both fell, red; when they disagree or either is unchanged, blue. Every exponential average starts from the simple average of its first values, and candles are left unpainted until both readings have a previous value to compare with.
How to read Elder Impulse System
Green says trend and momentum are pushing up together and red that they are pushing down together; blue is a pause or a disagreement. The usual reading is as a filter rather than a trigger: avoid buying on red bars and avoid selling short on green ones, and treat a change to blue after a run of one colour as the impulse fading.
The colours change bar by bar and can flicker in a sideways market. The average line takes the same colour as the candles, so the picture holds even with candle colouring turned off.
Settings
- EMA Length
- Bars in the exponential average that sets the trend reading and is drawn on the chart.
- MACD Fast Length
- Bars in the fast exponential average of the MACD line.
- MACD Slow Length
- Bars in the slow exponential average of the MACD line.
- MACD Signal Length
- Bars in the exponential average of the MACD line that the histogram is measured from.
Frequently asked questions
Why is a bar blue when price clearly rose?
Colour depends on whether the average and the histogram both rose, not on price. A bar can close higher while the histogram shrinks, and then the two readings disagree and the bar is blue.
Why are the first bars not coloured?
The histogram needs the slow average and then its signal average to fill before it exists, and one more bar before it can be compared. With the defaults the first coloured bar is the 35th.
Which alerts does it offer?
One when the impulse turns green and one when it turns red, each on the first bar of the new colour.