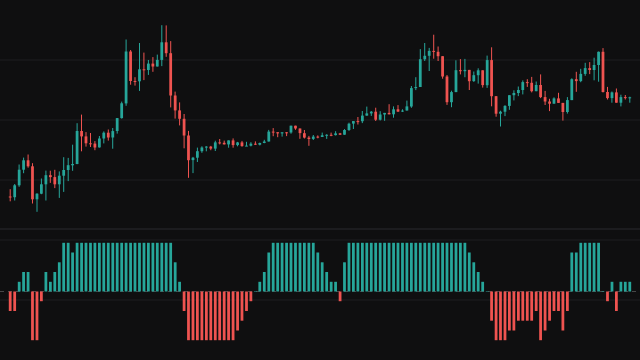
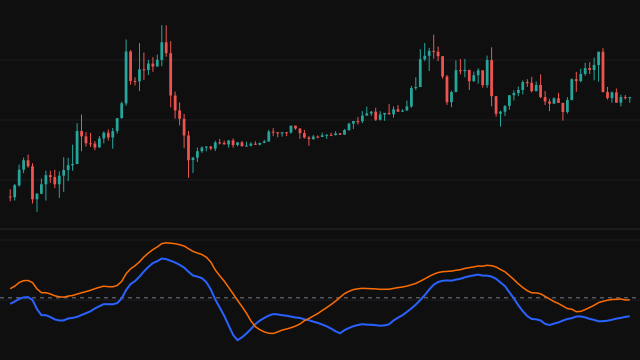
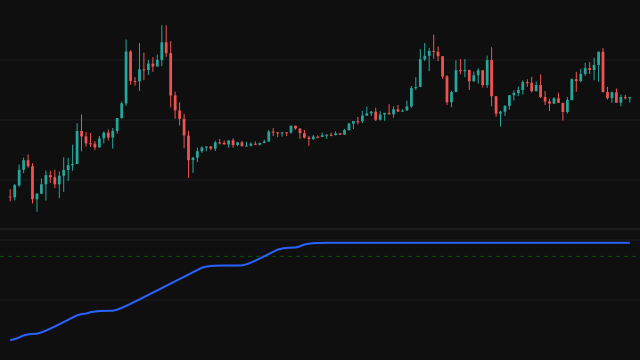
The Commodity Selection Index was set out by J. Welles Wilder to decide which markets are worth trading: the ones that trend strongly and move far enough to pay for the trade. It multiplies two of his own measures, ADXR for the strength of the trend and the average true range for volatility, by a constant built from the contract's terms.
ADXR is the mean of this bar's ADX and the ADX 14 bars ago, so it is a smoothed reading of how directional the market has been. The average true range is Wilder's smoothing of the true range over the same length. With ATR as Percent of Close on (the default) the average true range is divided by the close and shown as a percentage, so the index does not grow just because the price is higher.
The constant is the point value divided by the square root of the margin, divided by 150 plus the commission, times 100. With a point value and a margin of 1 and no commission it is 100 / 150, and the index is simply two thirds of ADXR times volatility. Every average is Wilder's smoothing, seeded with a simple average of its first values.
How to read Commodity Selection Index (CSI)
A higher CSI means a market that is both trending and moving a lot, which is the kind Wilder wanted to trade; a low CSI means a quiet or directionless market. The number is most useful as a ranking: put the same study on several instruments with the same settings and favour the ones with the highest readings, or watch one instrument's CSI rise as a trend gathers pace.
The index says nothing about direction: a strong fall scores as high as a strong rise, so pair it with the ADX direction lines or price itself. It is slow, needing about three times the length before its first value, and in price terms (with the percentage switched off) it only compares instruments of similar price.
Settings
- Length
- Bars in every Wilder average: the directional movement, the ADX, the lookback for ADXR and the average true range. 14 is Wilder's value.
- ATR as Percent of Close
- Measure volatility as a percentage of the close instead of in price, so readings compare across instruments and price levels.
- Point Value
- Money value of a one point move in the contract. It scales the index up or down in proportion.
- Margin
- Margin needed for one contract. The index is divided by its square root, so a market that ties up more capital ranks lower.
- Commission
- Commission for one round trip, added to 150 in the divisor, so a costlier market ranks a little lower.
Frequently asked questions
Why does the index use ADXR rather than ADX?
ADXR averages this bar's ADX with the value from one length ago, so it reacts more slowly and ranks markets on a steadier reading of trend strength.
Should I fill in the point value, margin and commission?
Only when you compare contracts whose terms differ. Within one instrument they just rescale the line, so the defaults of 1, 1 and 0 are fine.
Does a high reading mean buy?
No. It means the market is trending and volatile, in either direction. Use it to choose what to trade, and another tool to choose the side.