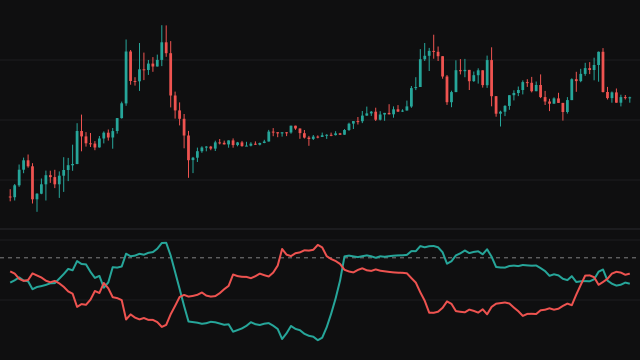
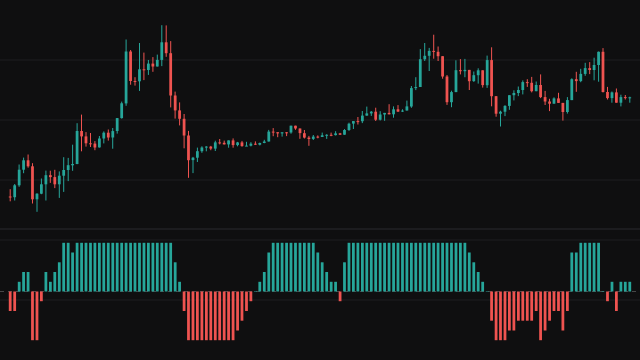
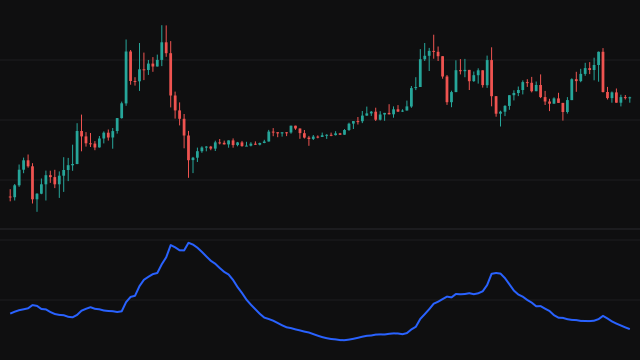
The Stiffness Indicator, designed by Markos Katsanos, measures how firmly a trend holds without falling back through its average. It first draws a bound a little under the trend: the 100 bar simple average of the close less 0.2 standard deviations of the close over the same 100 bars. The small allowance below the average keeps shallow dips from counting as breaks.
Each bar whose close is above the bound counts 1. The count over the last 60 bars, as a percentage of 60, is the raw stiffness, and the study smooths it with a 3 bar exponential average. The line runs from 0 to 100 in its own pane, with a dashed threshold at 90. The standard deviation is the population form, and the first value needs the average, the 60 bar count and the smoothing to fill, about 160 bars with the defaults.
How to read Stiffness Indicator
A reading of 90 or more means at least nine closes in ten over the window stayed above the bound: a stiff, orderly up trend with few penetrations of the average. Katsanos used a cross above 90 as the condition for joining a trend and a fall below 50 as the signal to leave it. Low readings mean price spends much of its time under the average, a weak or falling market.
The indicator only describes up trends, since it counts closes above a bound under the average. It is slow by design: the 60 bar window means it confirms a trend well after it starts and stays high for a while after it ends.
Settings
- Average Length
- Bars in the simple average and the standard deviation that define the bound. 100 is the published value.
- Deviation Multiplier
- How many standard deviations the bound sits below the average. 0.2 is the published value; a larger value forgives deeper dips.
- Stiffness Length
- Bars over which closes above the bound are counted. 60 is the published value; a shorter window reacts faster.
- Smoothing
- Bars in the exponential average applied to the percentage. 3 is the published value; 1 shows the raw percentage.
Frequently asked questions
Why is the bound below the average rather than at it?
A close a hair under the average is not a real break of the trend. Setting the bound 0.2 standard deviations lower lets small dips pass without counting against the trend.
What does stiffness mean here?
How rarely price falls through its average. A stiff trend rises with few closes under the bound, so the percentage stays near 100.
Does it work for down trends?
Not as it stands. It counts closes above a bound under the average, so a falling market simply reads low. A mirror version would count closes below a bound above the average.