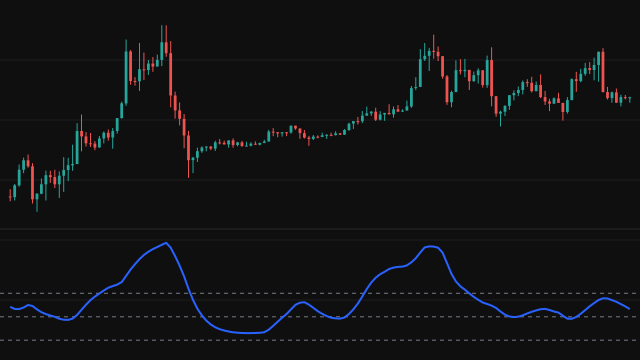
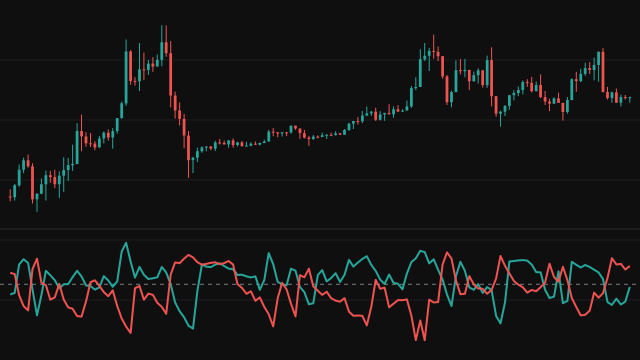
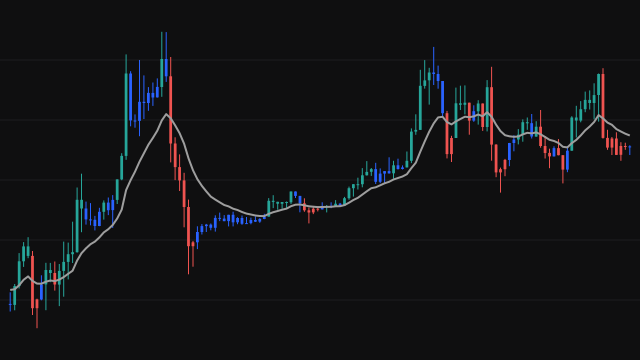
The Trend Intensity Index, described by M. H. Pee, measures how one-sided price has been around its own long average. Each bar's source is compared with its simple moving average over Length bars (60 by default), which gives a gap that is positive above the average and negative below it.
Over the most recent half of that length (30 bars by default, rounded down for an odd length), the study adds up the positive gaps and, separately, the size of the negative gaps. The index is the positive total as a percentage of both totals together, so it runs from 0 to 100. A Signal line, an exponential average of the index over Signal Length bars, is added to smooth it for crossings; it is not part of the index itself, which is read against its fixed levels.
How to read Trend Intensity Index (TII)
Readings above 80 mean price has spent most of the recent bars well above its long average, a strong uptrend; readings below 20 mean a strong downtrend. Around 50 the gaps above and below cancel out and there is no clear trend. A rise through 50, or the index crossing above its signal line, is read as a trend gaining strength, and the reverse as it fading.
Because the index weighs how far price is from the average, not only how often, one large move can hold it high for several bars. It starts only after the average and the first half window are complete, which takes about one and a half times the length.
Settings
- Source
- The price series compared with its average. Close is the default.
- Length
- Bars in the simple moving average. The gaps are summed over half this many bars. 60 is the usual value.
- Signal Length
- Bars in the exponential average that forms the signal line. A larger value gives a smoother, slower line.
Frequently asked questions
Why sum over only half of the length?
The long average sets the reference level, and the shorter half window measures what price has done recently around it, so the index responds to the current trend rather than the whole history the average covers.
What do 80 and 20 mean?
Above 80, about four fifths of the recent distance from the average was on the upside, a strong uptrend. Below 20 the same holds on the downside.
Why does it start so late?
It needs the full moving average and then half a length of gaps, so with the defaults the first value appears on the 89th bar.