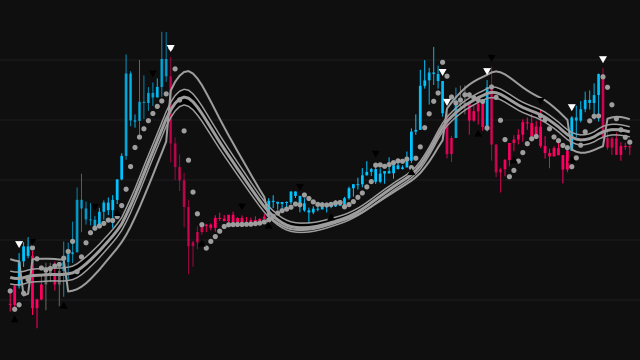
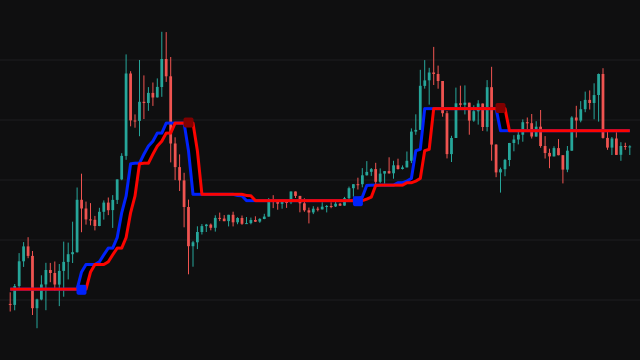
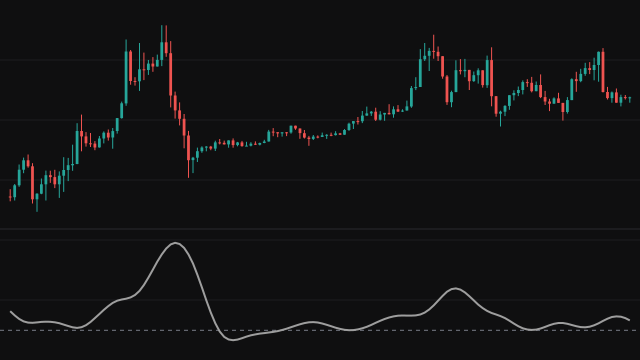
UT Bot follows price with a trailing stop set by volatility. The distance is the Sensitivity times the average true range over ATR Period bars, Wilder's average. While the price stays above the stop, the stop sits that far below it and only ever rises; while the price stays below, it sits that far above and only ever falls. When the price crosses the stop, the stop jumps to the other side.
A short moving average of the same price (Hull by default, over two bars) is drawn in green beside the stop in red. A Buy label marks the bar where the average crosses above the stop while the price is above it, and a Sell label the reverse. Candles are green while the price is above the stop and red while it is below.
The price can be read from ordinary candles or from Heikin Ashi candles, whose close is the bar's average price and whose open is the midpoint of the previous Heikin Ashi open and close. The default price is the open, which does not change while a bar forms.
How to read UT Bot
Read the candle colour as the side: green while the price holds above the trailing stop, red while it holds below. The labels mark the changes, and the red stop line is where the current side would end.
With the defaults the study reacts quickly and labels often, which suits a trader who wants every turn. A larger Sensitivity keeps the stop further away and labels less often; a longer ATR Period steadies the distance. Heikin Ashi prices smooth the input and usually cut the number of labels in a choppy market, at the cost of reacting later.
Settings
- Signals from Heikin Ashi Candles
- Read the price from Heikin Ashi candles instead of the ordinary ones. Smoother, with fewer and later signals.
- Price Source
- Which price the stop and the average follow. Open is the default and does not change while a bar forms.
- Moving Average Type
- The average drawn against the stop: simple, exponential, weighted or Hull.
- MA Period
- Bars in that moving average. Two keeps it close to price.
- Sensitivity
- How many average true ranges the stop sits from the price. Larger values give fewer signals.
- ATR Period
- Bars in Wilder's average of the true range that sets the stop's distance.
Frequently asked questions
Why are there so many labels with the defaults?
A Sensitivity of 1 and a two-bar average keep everything close to price, so small turns cross the stop. Raise the Sensitivity, or read prices from Heikin Ashi candles, to see fewer.
Does it place orders?
No. It is a study: it draws the stop, the average, the labels and the candle colours, and raises a Buy or Sell alert. Turning it into a strategy is a separate script.
Why is open the default price?
The open is fixed for the whole bar, so a label cannot appear and then vanish while the bar is still forming.